Design Alternatives
Several beam alternatives were developed by varying section geometry and strand layout. Each option was checked for strength, serviceability, ductility, constructability at TPAC, and competition scoring potential.
| Design | Design 1 | Design 2 | Design 3 |
|---|---|---|---|
| Design | 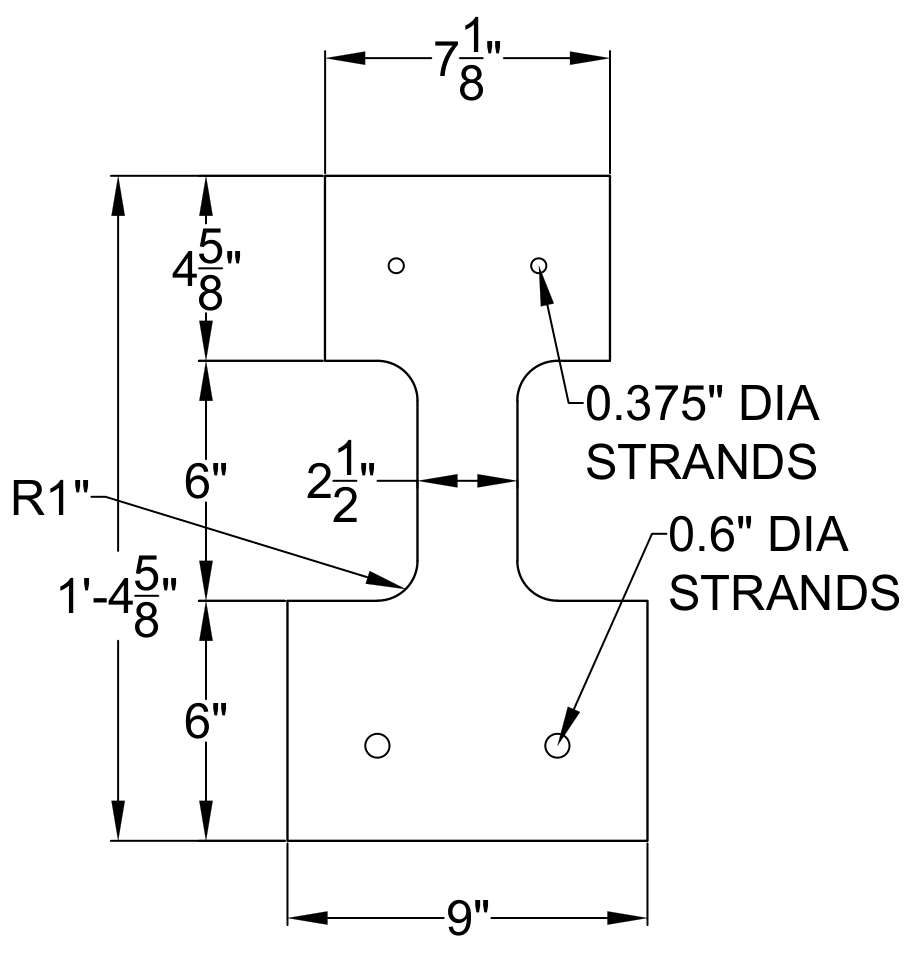 |
 |
 |
| Difference |
Most ductility Greatest bottom flange thickness Smallest overall height Greatest flange widths |
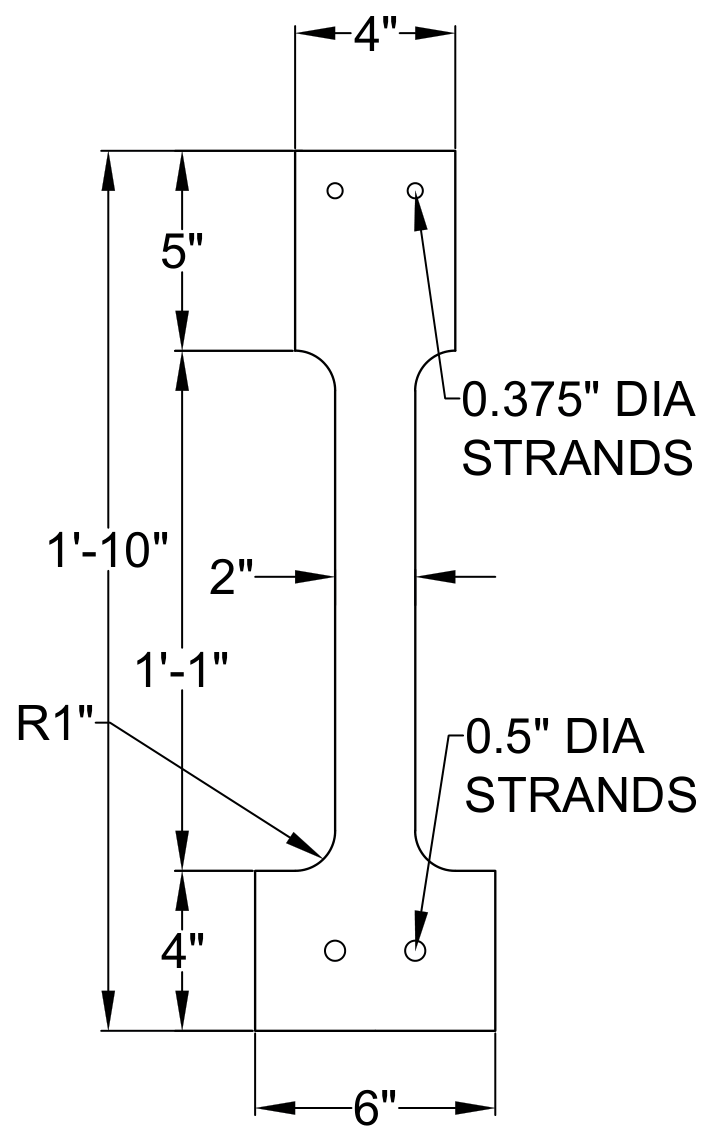
Most economic Greatest top flange thickness Narrowest design |
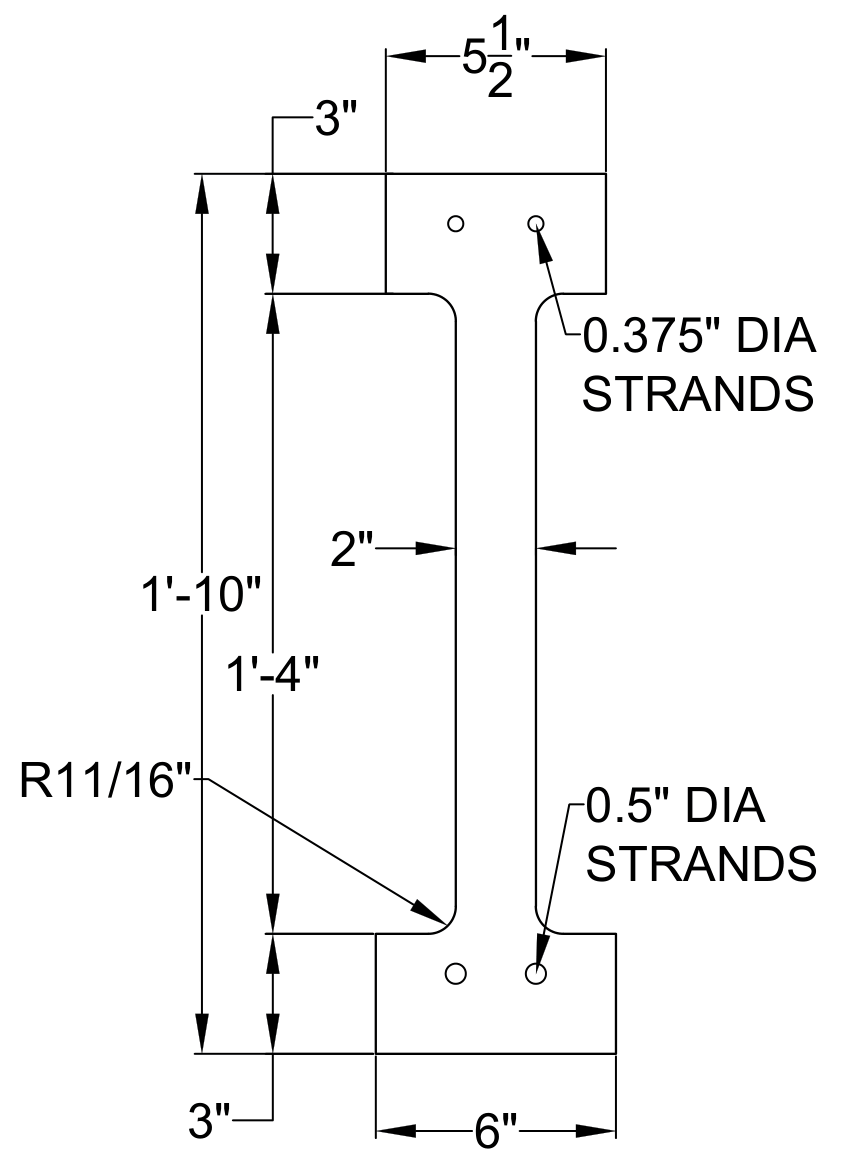
Lightest Smaller chamfer radius Overall slender shape Uniform design for ease of construction |
| Result |
Weight: 1,660 lb Cost: $298.42 |
Weight: 1,161 lb Cost: $293.61 |
Weight: 1,079 lb Cost: $300.70 |
Decision Matrices
A weighted decision matrix was used to compare alternatives based on PCI competition scoring criteria. Cracking/capacity was scored out of 20 points, cost was scored out of 10 points, weight was scored out of 10 points, deflection was scored out of 10 points, and practicality/innovation/code considerations were scored out of 5 points. This created a total possible score of 55 points for each design. Scores for each design can be found below.
| Name | Design | Cracking/Capacity | Cost | Weight | Deflection | Pract/Inn/Code | Total |
|---|---|---|---|---|---|---|---|
| Design 1 | |
20 | 3 | 0 | 10 | 3 | 36 |
| Design 2 | |
20 | 10 | 9 | 0 | 3 | 42 |
| Design 3 | |
20 | 0 | 10 | 9 | 4 | 43 |
Final Design Details
The final beam is a prestressed concrete member designed for the PCI loading configuration. Based on the results of the decision matrix, Design 3 was selected to move forward as the final design. This alternative provided the best overall balance of weight, constructability, cost, and expected performance.
- Section type: I-Beam
- Estimated concrete release strength, f′ci: 5,000 psi
- Estimated 28-day compressive strength, f′c: 8,000 psi
- Bottom prestressing strands: 2 × 0.5 in strands pulled to 30.98 kips each
- Top prestressing strands: 2 × 0.375 in strands pulled to 4.59 kips each
- Mild reinforcement: Refer to the Shop Drawings for reinforcement layout and detailing.
Construction Cost Tracking
This section compares the actual labor hours completed during the project with the updated engineering cost estimate.
Actual Labor Hours
This table documents the actual hours spent by each role throughout the project.
| Task Name | SENG (hr) | STEG (hr) | INT (hr) | LBT (hr) | Total Hours |
|---|---|---|---|---|---|
| Task 1 – Research & Preparation | 0 | 8 | 16 | 5 | 29 |
| Task 1.1 Technical Research | 0 | 4 | 7 | 1 | |
| Task 1.2 Material Testing Plan | 0 | 4 | 9 | 4 | |
| Task 2 – Beam Analysis & Design | 17 | 113 | 105 | 0 | 235 |
| Task 2.1 Analysis of Load and Material | |||||
| Task 2.1.1 Calculate Beam Initial Conditions | 0 | 4 | 4 | 0 | |
| Task 2.1.2 Select Concrete Mix for Design | 0 | 6 | 3 | 0 | |
| Task 2.2 Create Analysis Spreadsheet | 6 | 25 | 25 | 0 | |
| Task 2.3 Design Decision Matrix | 2 | 6 | 8 | 0 | |
| Task 2.4 Select Best Design | |||||
| Task 2.4.1 Determine Cross-Section Dimensions | 0 | 14 | 12 | 0 | |
| Task 2.4.2 Design Prestressing Layout | 0 | 11 | 10 | 0 | |
| Task 2.4.3 Refine Beam Dimensions | 1 | 13 | 14 | 0 | |
| Task 2.4.4 Evaluate Performance Against Design Criteria | 4 | 13 | 16 | 0 | |
| Task 2.4.5 Refinement of Final Beam Design | 4 | 21 | 13 | 0 | |
| Task 3 – Engineering Shop Drawings | 8 | 25 | 20 | 0 | 53 |
| Task 3.1 Create Shop Drawings | 2 | 14 | 7 | 0 | |
| Task 3.2 Internal Review | 5 | 8 | 3 | 0 | |
| Task 3.3 External Review | 1 | 3 | 10 | 0 | |
| Task 4 – Fabrication & Engineer's Site Visit | 6 | 11 | 12 | 9 | 38 |
| Task 4.1 Beam Fabrication & Observation | 4 | 8 | 8 | 2 | |
| Task 4.2 Cylinder Testing & Beam Predictions | |||||
| Task 4.2.1 One-Day Test | 0 | 0 | 0 | 0 | |
| Task 4.2.2 Seven-Day Test | 0 | 0 | 0 | 0 | |
| Task 4.2.3 Fourteen-Day Test | 0 | 0 | 1 | 3 | |
| Task 4.2.4 Twenty-One-Day Test | 0 | 0 | 0 | 2 | |
| Task 4.2.5 Day of Testing Test | 0 | 0 | 0 | 2 | |
| Task 4.3 Final Beam Predictions | 2 | 3 | 3 | 0 | |
| Task 5 – Delivery & Setup | 4 | 5 | 8 | 4 | 21 |
| Task 5.1 Transportation | 0 | 4 | 4 | 0 | |
| Task 5.2 Testing Preparation | 4 | 1 | 4 | 4 | |
| Task 6 – Beam Testing | 5 | 0 | 4 | 8 | 17 |
| Task 6.1 Load Testing on Beam | 2 | 0 | 2 | 5 | |
| Task 6.2 Analyze Test Results | 3 | 0 | 2 | 3 | |
| Task 7 – Finalize Report & Submit to PCI | 8 | 10 | 32 | 0 | 50 |
| Task 8 – Project Impacts | 1 | 3 | 6 | 2 | 12 |
| Task 9 – Deliverables | 7 | 18 | 72 | 1 | 98 |
| Task 9.1 30% Project Progress Report | 1 | 2 | 15 | 0 | |
| Task 9.2 60% Project Progress Report | 1 | 3 | 16 | 0 | |
| Task 9.3 90% Project Progress Report | 1 | 4 | 11 | 1 | |
| Task 9.4 Final Presentation | 1 | 5 | 10 | 0 | |
| Task 9.5 Final Project Report | 3 | 4 | 20 | 0 | |
| Task 10 – Project Management | 5 | 25 | 26 | 20 | 76 |
| Task 10.1 Meetings | 4 | 20 | 20 | 15 | |
| Task 10.2 Tracking Project Progress | 1 | 5 | 6 | 5 | |
| Total Hours | 61 | 218 | 301 | 49 | 629 |
Updated Engineering Cost
This table updates the engineering cost estimate using the actual labor hours completed during the project.
| Item | Unit | Quantity | $ / Unit | Cost |
|---|---|---|---|---|
| 1.0 Personnel | ||||
| SENG | HR | 61 | $275 | $16,775 |
| STEG | HR | 218 | $140 | $30,520 |
| INT | HR | 301 | $65 | $19,565 |
| LBT | HR | 49 | $70 | $3,430 |
| Total Personnel | HR | 629 | – | $70,290 |
| 2.0 Travel | ||||
| Mileage Rate | MILE | 288 | $0.15 | $43 |
| Sedan Rental | DAY | 1 | $40.00 | $40 |
| Total Travel | $83 | |||
| 3.0 Supplies | ||||
| Lab Rental + Consumables | DAY | 6 | $100 | $600 |
| Software Licensing | WEEK | 16 | $93 | $1,488 |
| Forklift and Operator | HR | 2 | $300 | $600 |
| Total Supplies | $2,688 | |||
| 4.0 Subcontract | ||||
| TPAC | LS | 1 | $10,000 | $10,000 |
| Combined Total | $83,061 | |||