

To initiate the design process, the team conducted a comprehensive site investigation to evaluate the existing drainage infrastructure, complete a FAST form (available via the icon above), and identify problem areas across the golf course. During this effort, it was observed that the existing culverts and channel along the Rio de Flag are undersized and unable to efficiently convey stormwater during major storm events, which contributes to flooding throughout the course. In addition, the FAST form was used to document channel conditions, wildlife observations, and potential causes of instability; these findings indicate generally stable conditions overall, with some localized areas that may benefit from targeted stabilization and erosion control measures. Furthermore, the team utilized DroneDeploy software to analyze site conditions and identify drainage deficiencies, ultimately locating 18 ponding areas that require further evaluation and potential improvements.
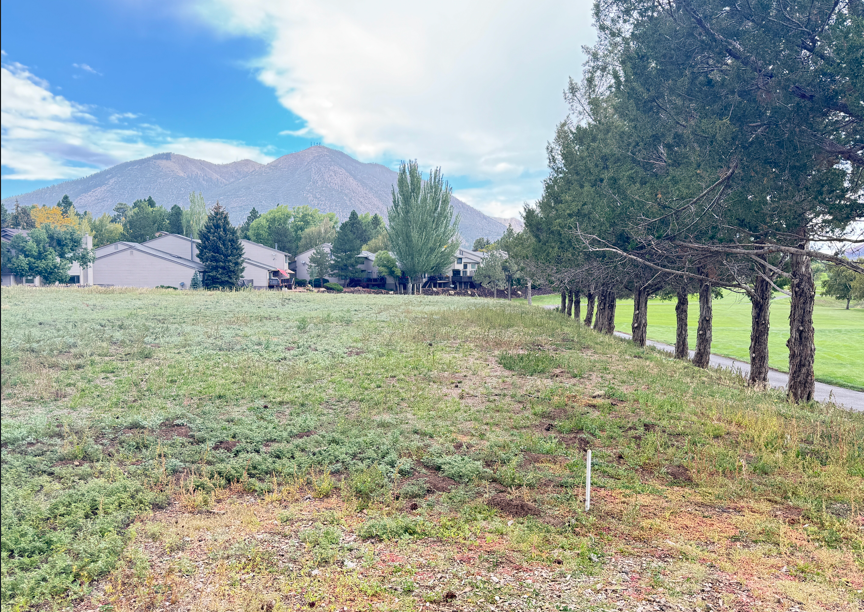
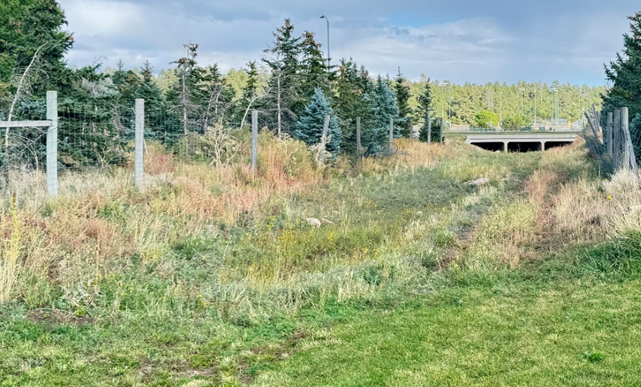
Erosion and plant life at Hole 1
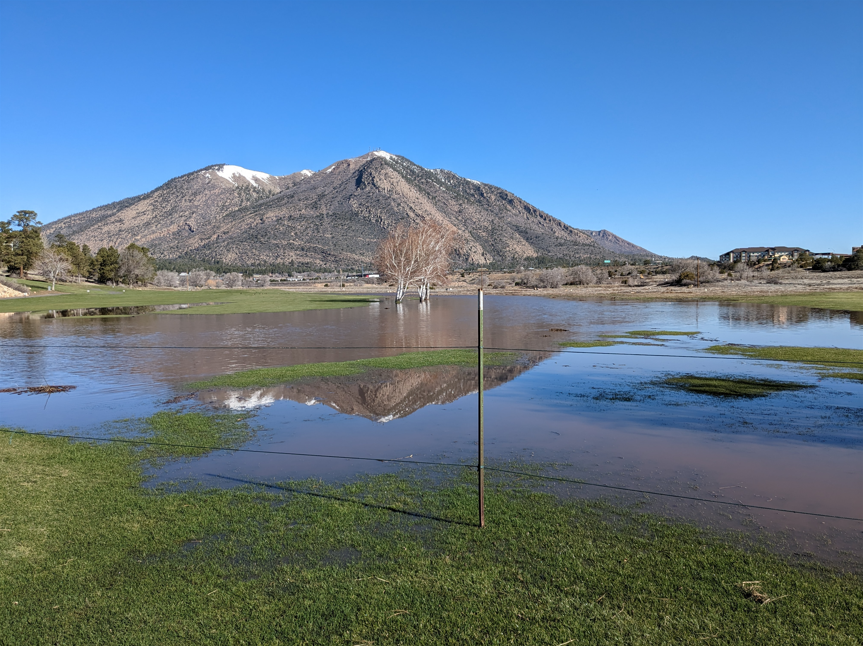
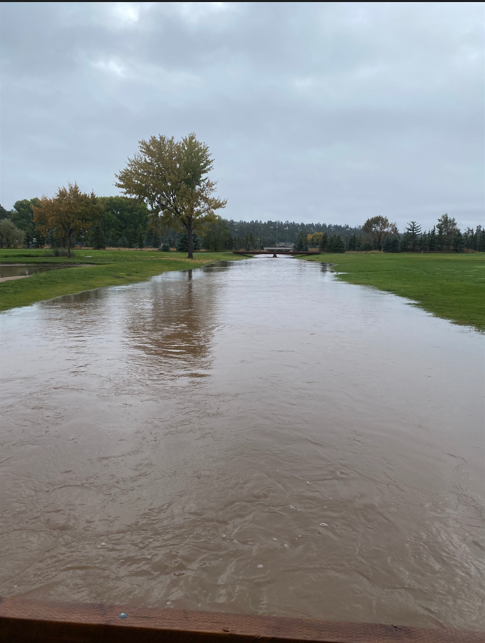
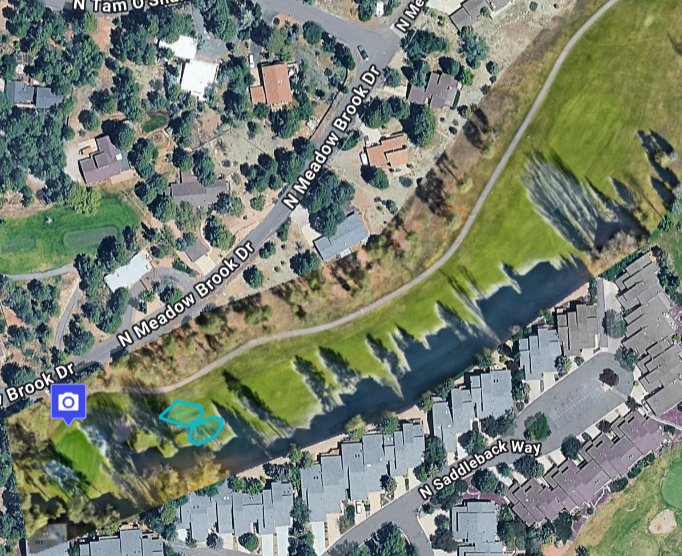
Flooding at Hole 7
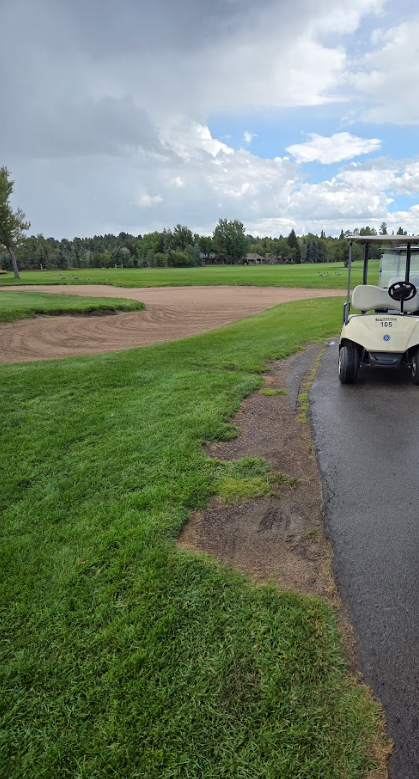
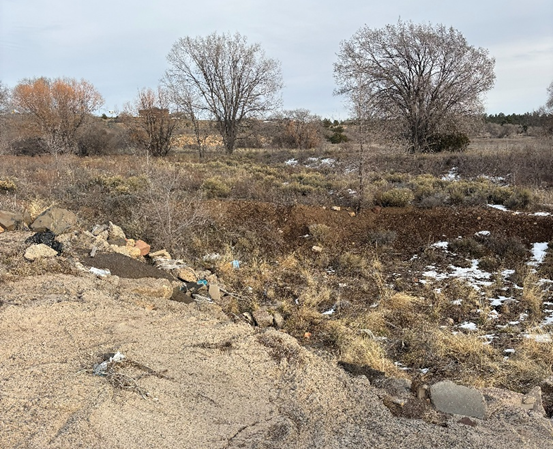
Erosion at Hole 2
Flooding down the Rio de Flag
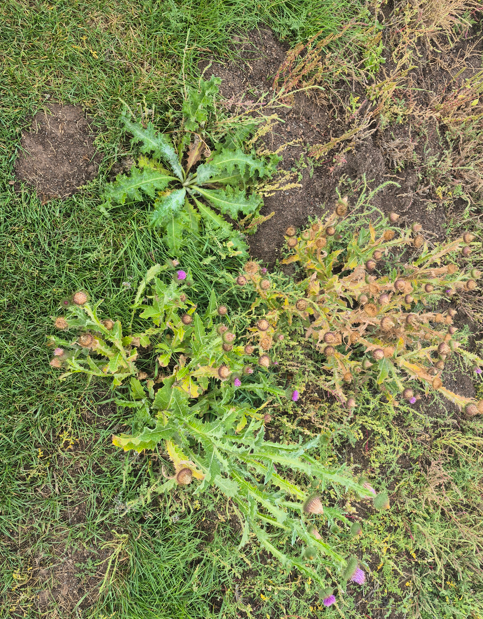
Canada Thistle and Cat's Ear
To determine watershed properties contributing runoff to the identified improvement locations, the team utilized topographic survey data collected during the drone survey to delineate drainage boundaries and calculate watershed areas throughout the golf course. These drainage areas were then used in the Rational Method to calculate peak discharge rates. A uniform runoff coefficient representing lawn cover underlain by clay soils with relatively flat slopes was applied across all watersheds, and rainfall intensities for the 50-year and 100-year storm events were obtained from regional intensity–duration–frequency (IDF) data.
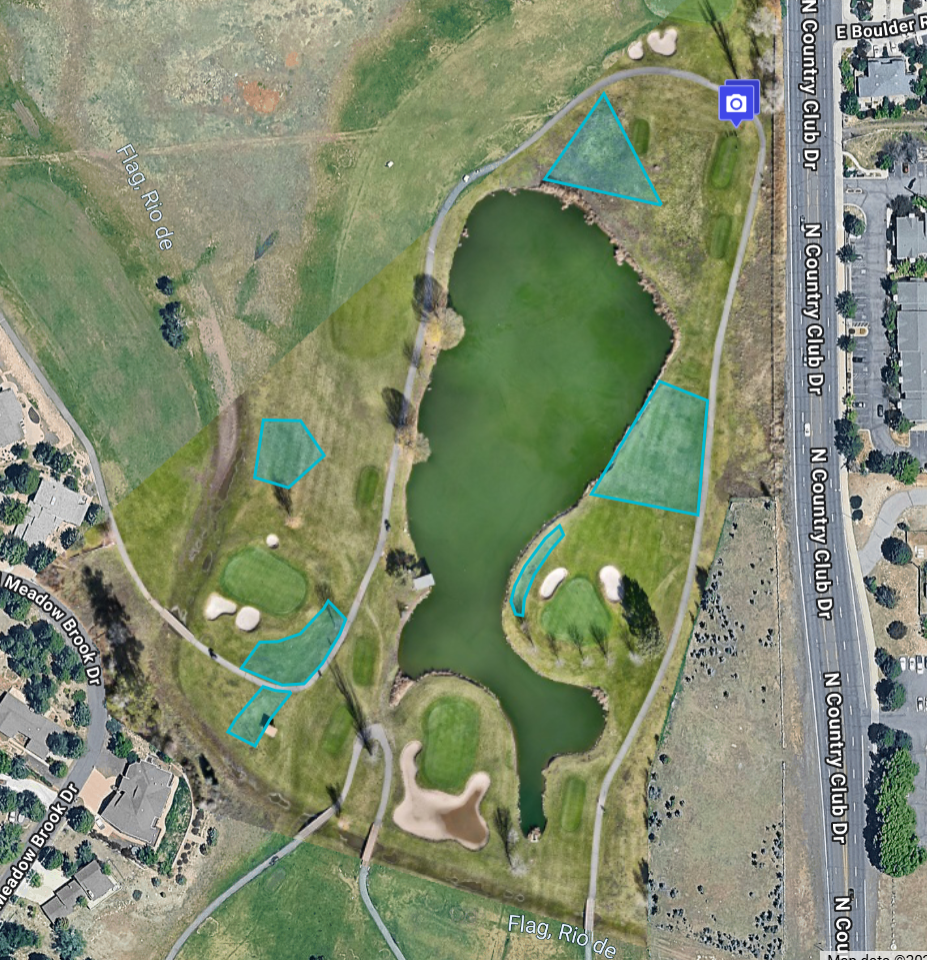
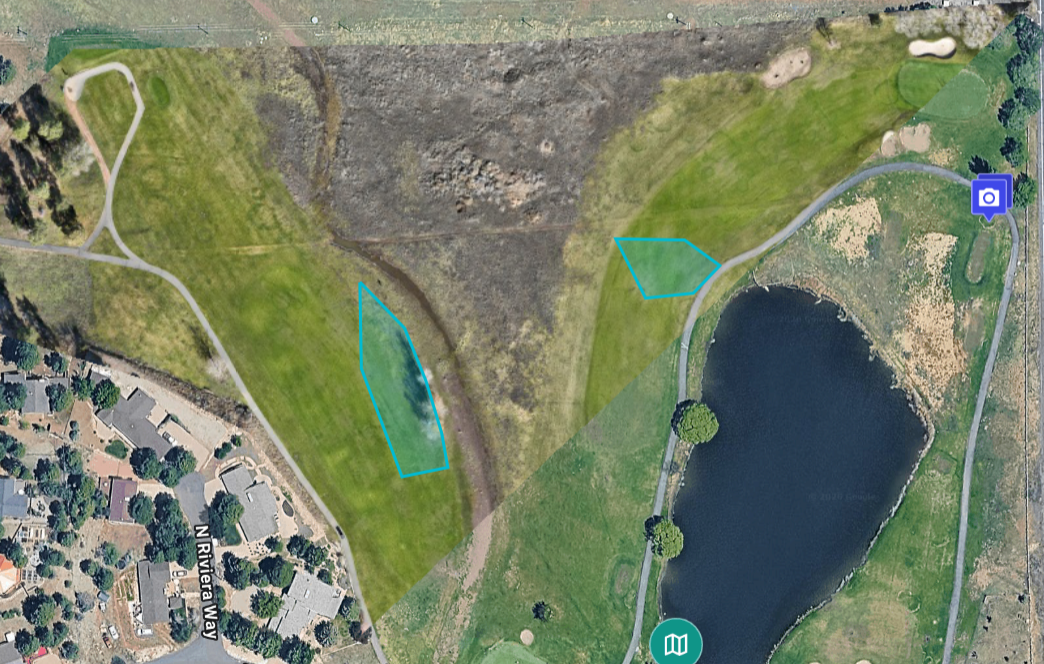
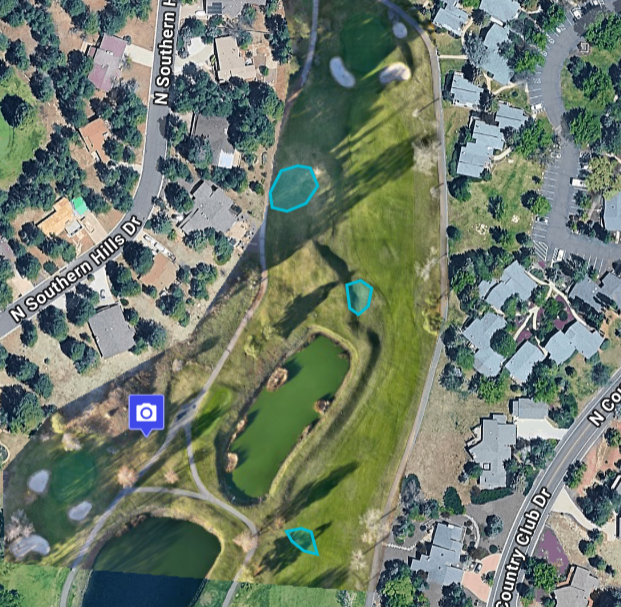
Depressions at Holes 6 & 7
Depressions at Hole 5
Depressions at Holes 2,3,7,8,9
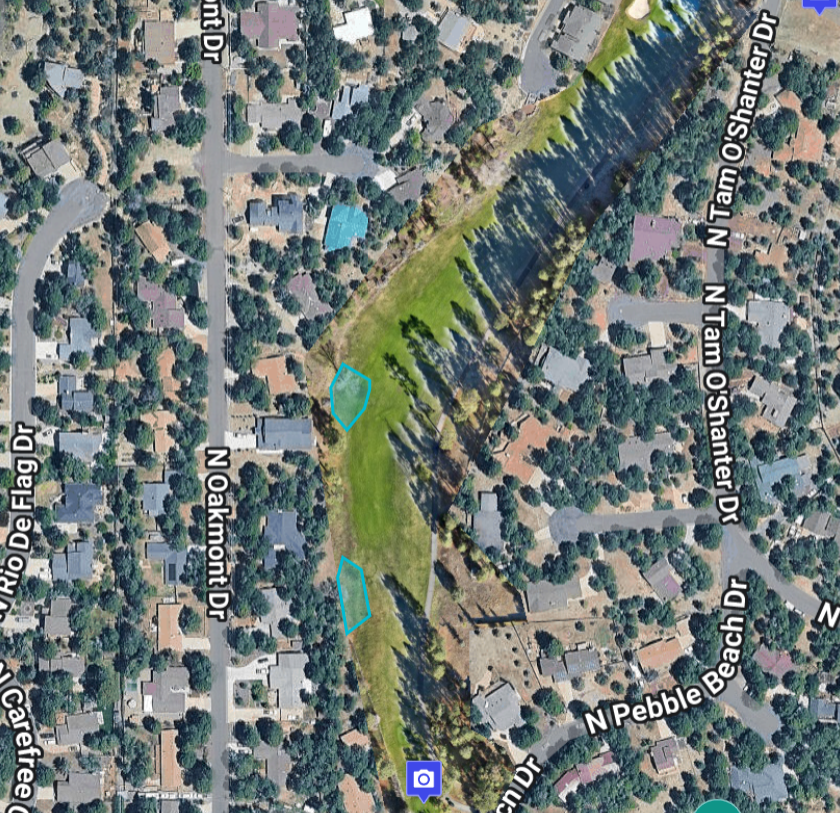
Depressions at Hole 17
Depressions at Hole 3
Depressions at Holes 17 & 18
To analyze the hydraulic conditions of the culverts and the Rio de Flag channel, the team utilized StreamStats, CulvertMaster, and FlowMaster. StreamStats was used to determine watershed areas and estimate flow rates for both the 50-year design storm and 100-year check storm, as they are considered road use culverts. These flow rates, along with culvert dimensions and roadway characteristics, were analyzed in CulvertMaster to evaluate culvert performance and potential overtopping conditions. Additionally, Drone Deploy was used to obtain cross-section data along the Rio de Flag, which was then input into FlowMaster to estimate discharge and flow area throughout the channel.
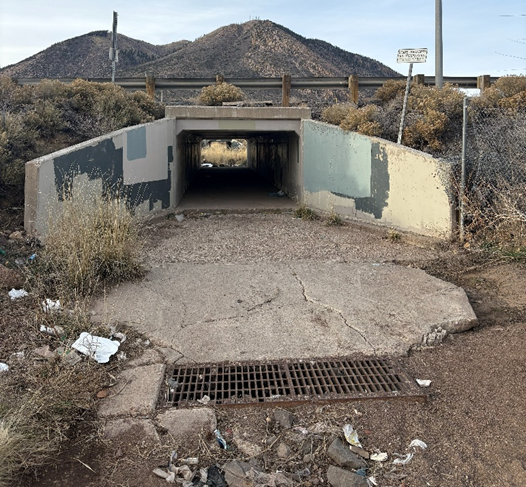
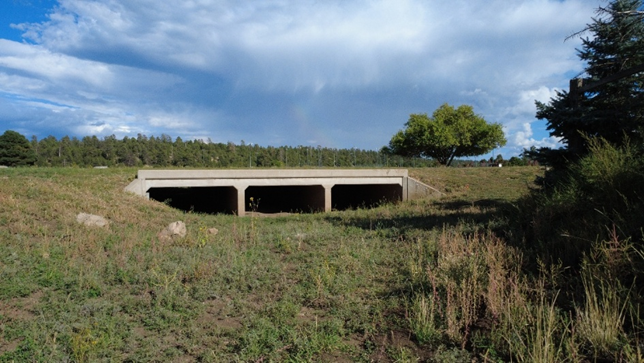
Northern Culvert Conditions ↕
Eastern Culvert Conditions ↕
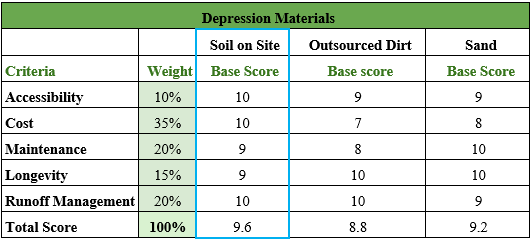
The first matrix created by the team was used to determine the materials the team wanted to use to fill in the depressions throughout the course to improve runoff, redirecting the water into the existing hydraulic structures at the site. After careful consideration, the team was able to choose between using the soil at the site provided by the golf course, soil outsourced from a third party, or sand outsourced from a third party with a 1-10 scale. The results of this analysis are shown in the summarized table below, blue highlighting he chosen alternative, and with the full table shown in APPENDIX 9: MATRIX RESULTS of the "Final Report" found in the documents page.
documents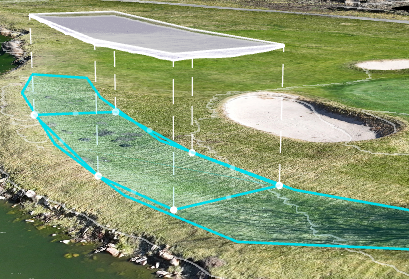
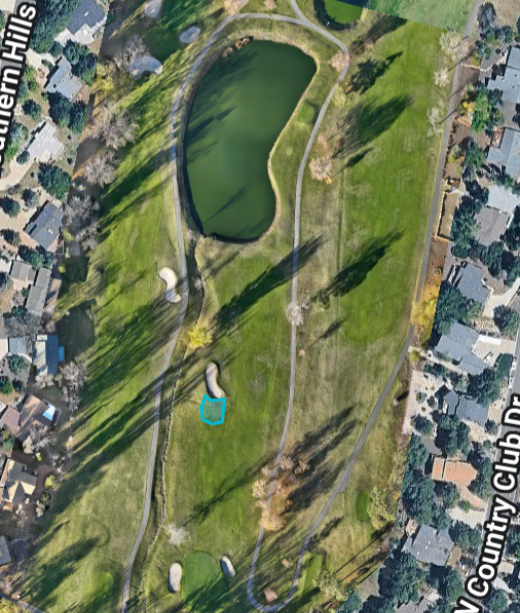
Depression Example
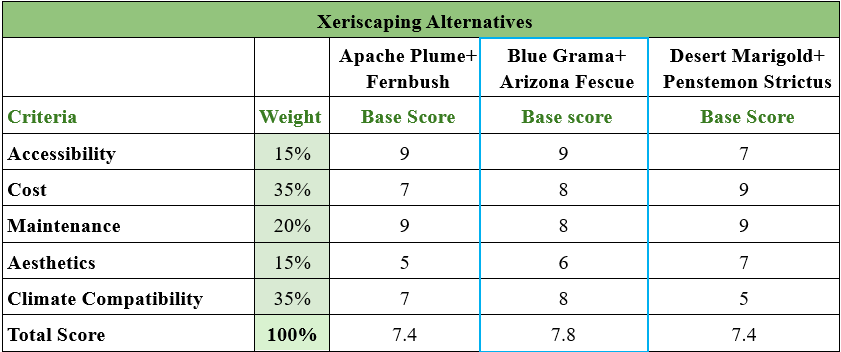
The second matrix created was used to determine what plants the team wanted to use to implement xeriscaping within the designated areas determined by our team at the site. Research was conducted in cohabitating xeriscaping plants native to Flagstaff. As a result, the team chose to consider the plant combinations of Apache Plume and Fernbush, Blue Grama and Arizona Fescue, and Desert Marigold and Penstemon Strictus on a 1-10 scale. The result of this analysis is shown in the table below, blue highlighting he chosen alternative, and with the full table in APPENDIX 9: MATRIX RESULTS of the "Final Report" found in the documents page.
documents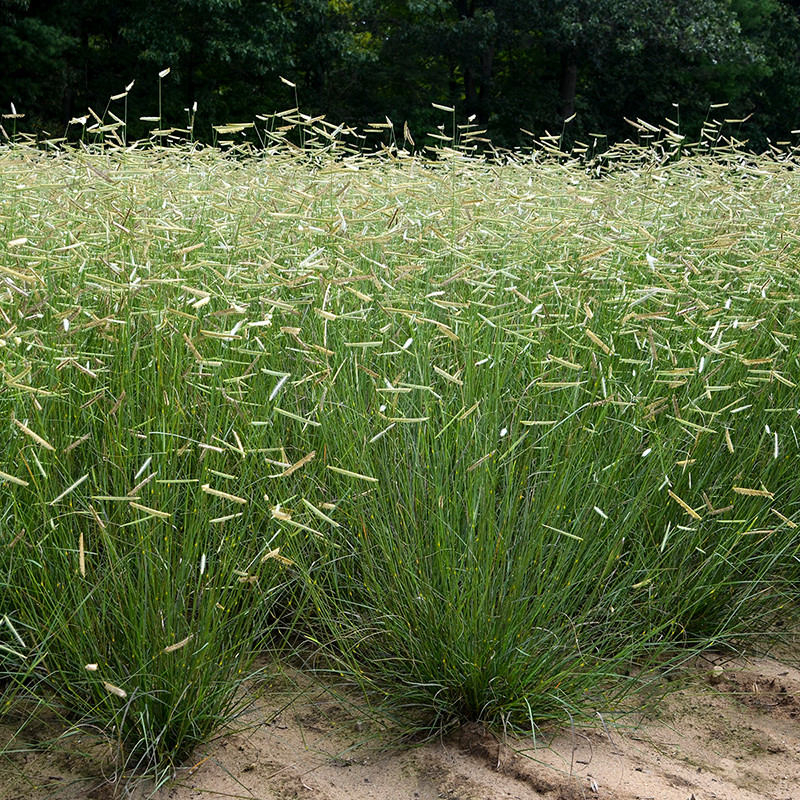
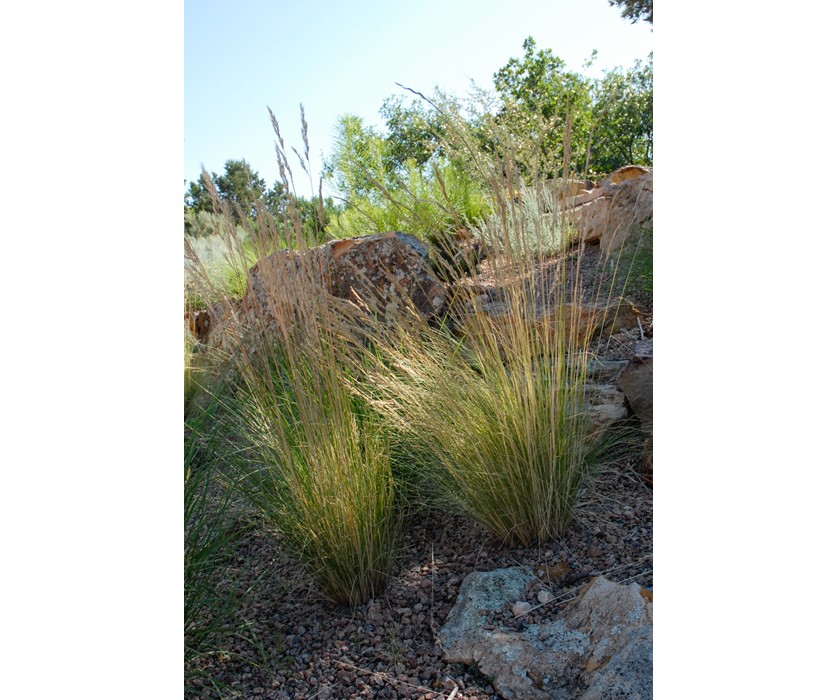
Blue Grama (L) & Arizona Fescue (R)
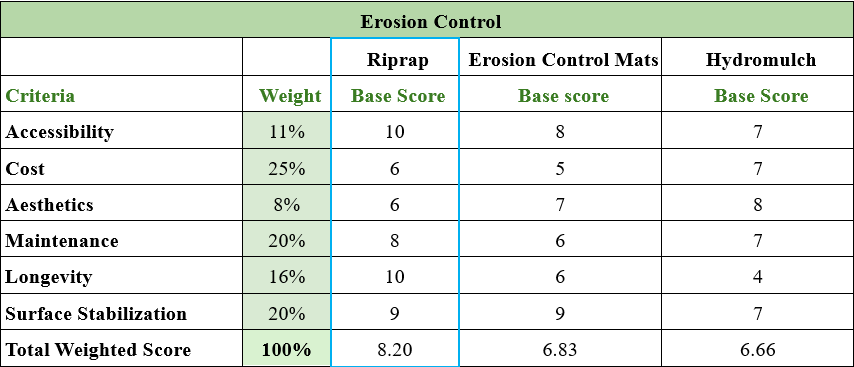
The last matrix created by the team was to determine the type of erosion-control that would best fix the damage done at the edges of the cart pathways and prevent future damage from the floods. After some deliberation, the alternatives of riprap, erosion control mats, and hydromulch at a 1-10 scale. When these solutions are implemented, they will also be paired with landscaping bricks in the curves of the pathways where these alternatives may fall short. The result of this analysis is shown in the table below, blue highlighting he chosen alternative, and with a full table in APPENDIX 9: MATRIX RESULTS of the Final Report found in the documents page.
documents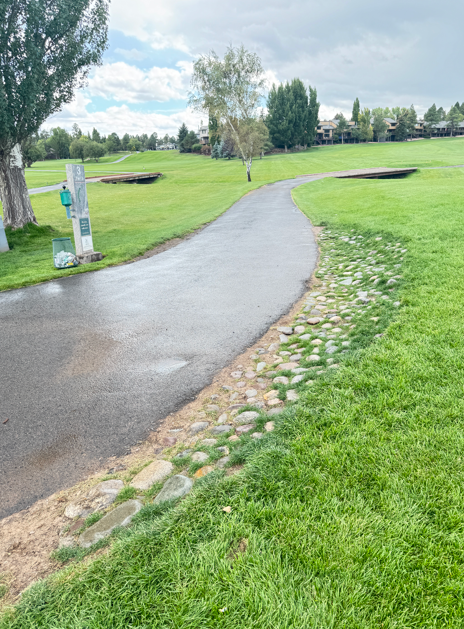
Riprap Implemented
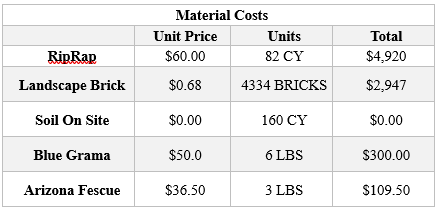
Each solution proposed in the final design will be completed by the Continental Country Club grounds keeping staff and will be spaced out in construction phases. These construction phases will allow the team to keep the total amount of material cost for each phase under the $2500 budget constraint and coincide with golf course operations. As a result, the following prices account for only material cost for each solution shown in the table below. These numbers do not include haul or construction costs or the cost for soil, since the soil used for the proposed improvements will be utilized on site. A complete breakdown of material costs can be found in APPENDIX 11: MATERIAL COSTS of the "Final Report" found in the documents page.
These findings and recommendations are reflected in the final design CAD file, which organizes the golf course by each hole to clearly show the proposed improvements and can be viewed in the Documents page under "Plan Set". The final design includes 39 areas for riprap implementation, 16 areas for landscape brick, and 18 depressions to be filled. Riprap and landscape brick are shown in the design to stabilize areas and reduce erosion within grass areas and along golf cart paths, while the depressions are designated to be filled to improve drainage and reduce erosion throughout the playable areas of the course. Xeriscaping with Blue Grama and Arizona Fescue is added throughout the site to improve the level of maintenance and the aesthetic of the golf course.
The plan set is a comprehensive, structured package of technical drawings, specifications, and design details created by our team to guide the construction, rehabilitation, and management of the golf course’s water-related infrastructure. It clearly delineates all proposed improvement areas across the course along with the corresponding solutions for each hole. The plan set also includes a summarized table explaining the symbols and color coding used throughout the drawings, as well as outlining the estimated water usage savings associated with each hole. The full PDF of the plan set can be found on the Documents page under “Plan Set.”
documents