Project Design
This RSA followed a standard engineering design process which involved first generating various alternatives for each project intersection that would be split into short/medium/long term categories. After, we evaluated each alternative in a decision matrix to determine the most effective solutions overall. Then, we finalized our recommendations and determined the total cost of implementing each one. Found below are links to each section of the design process for further detail.


Potential Alternatives
After visiting each project intersection and completing site visits, we recorded the various safety issues apparent to us and came up with potential solutions to counteract these problems. Below are our site observations and photos with the initial solutions we generated.
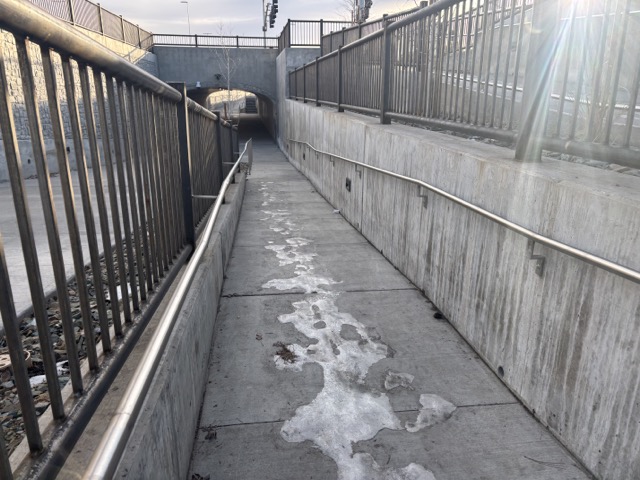
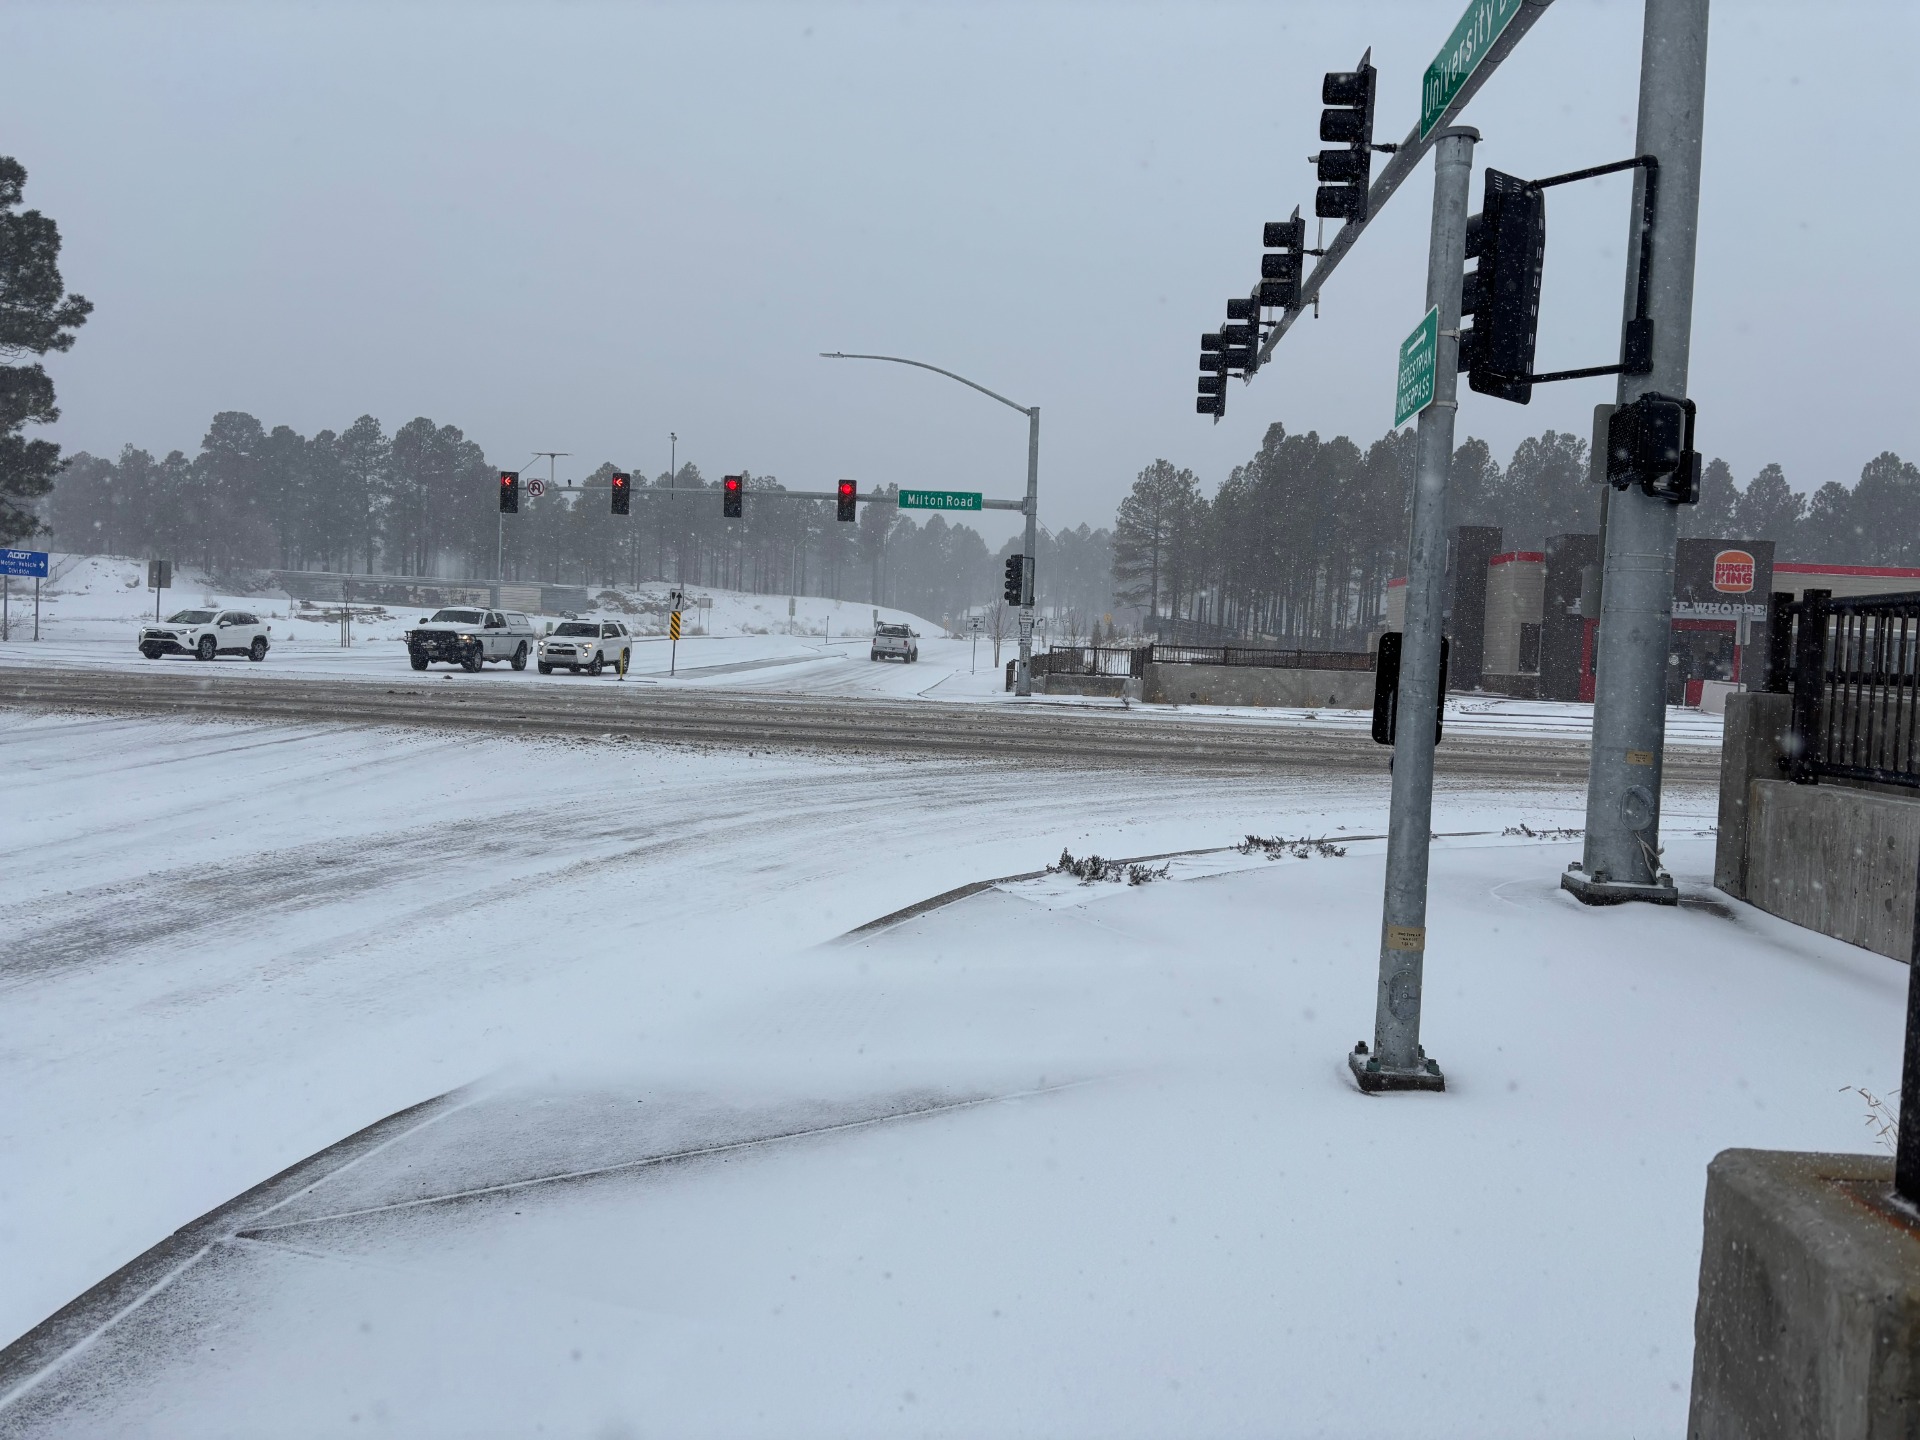
Project Location 1- University Ave and Milton Rd
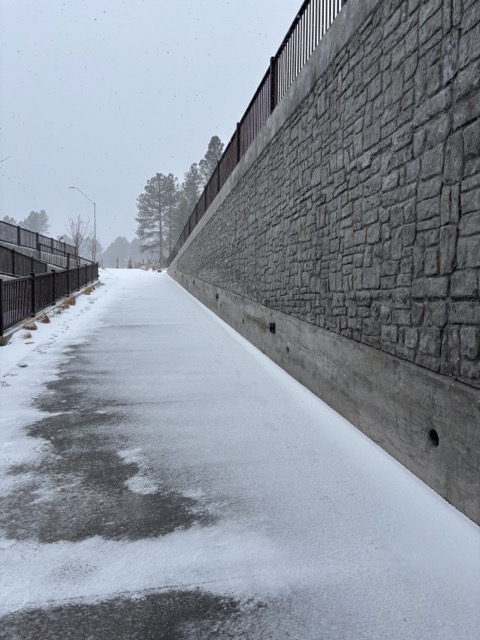
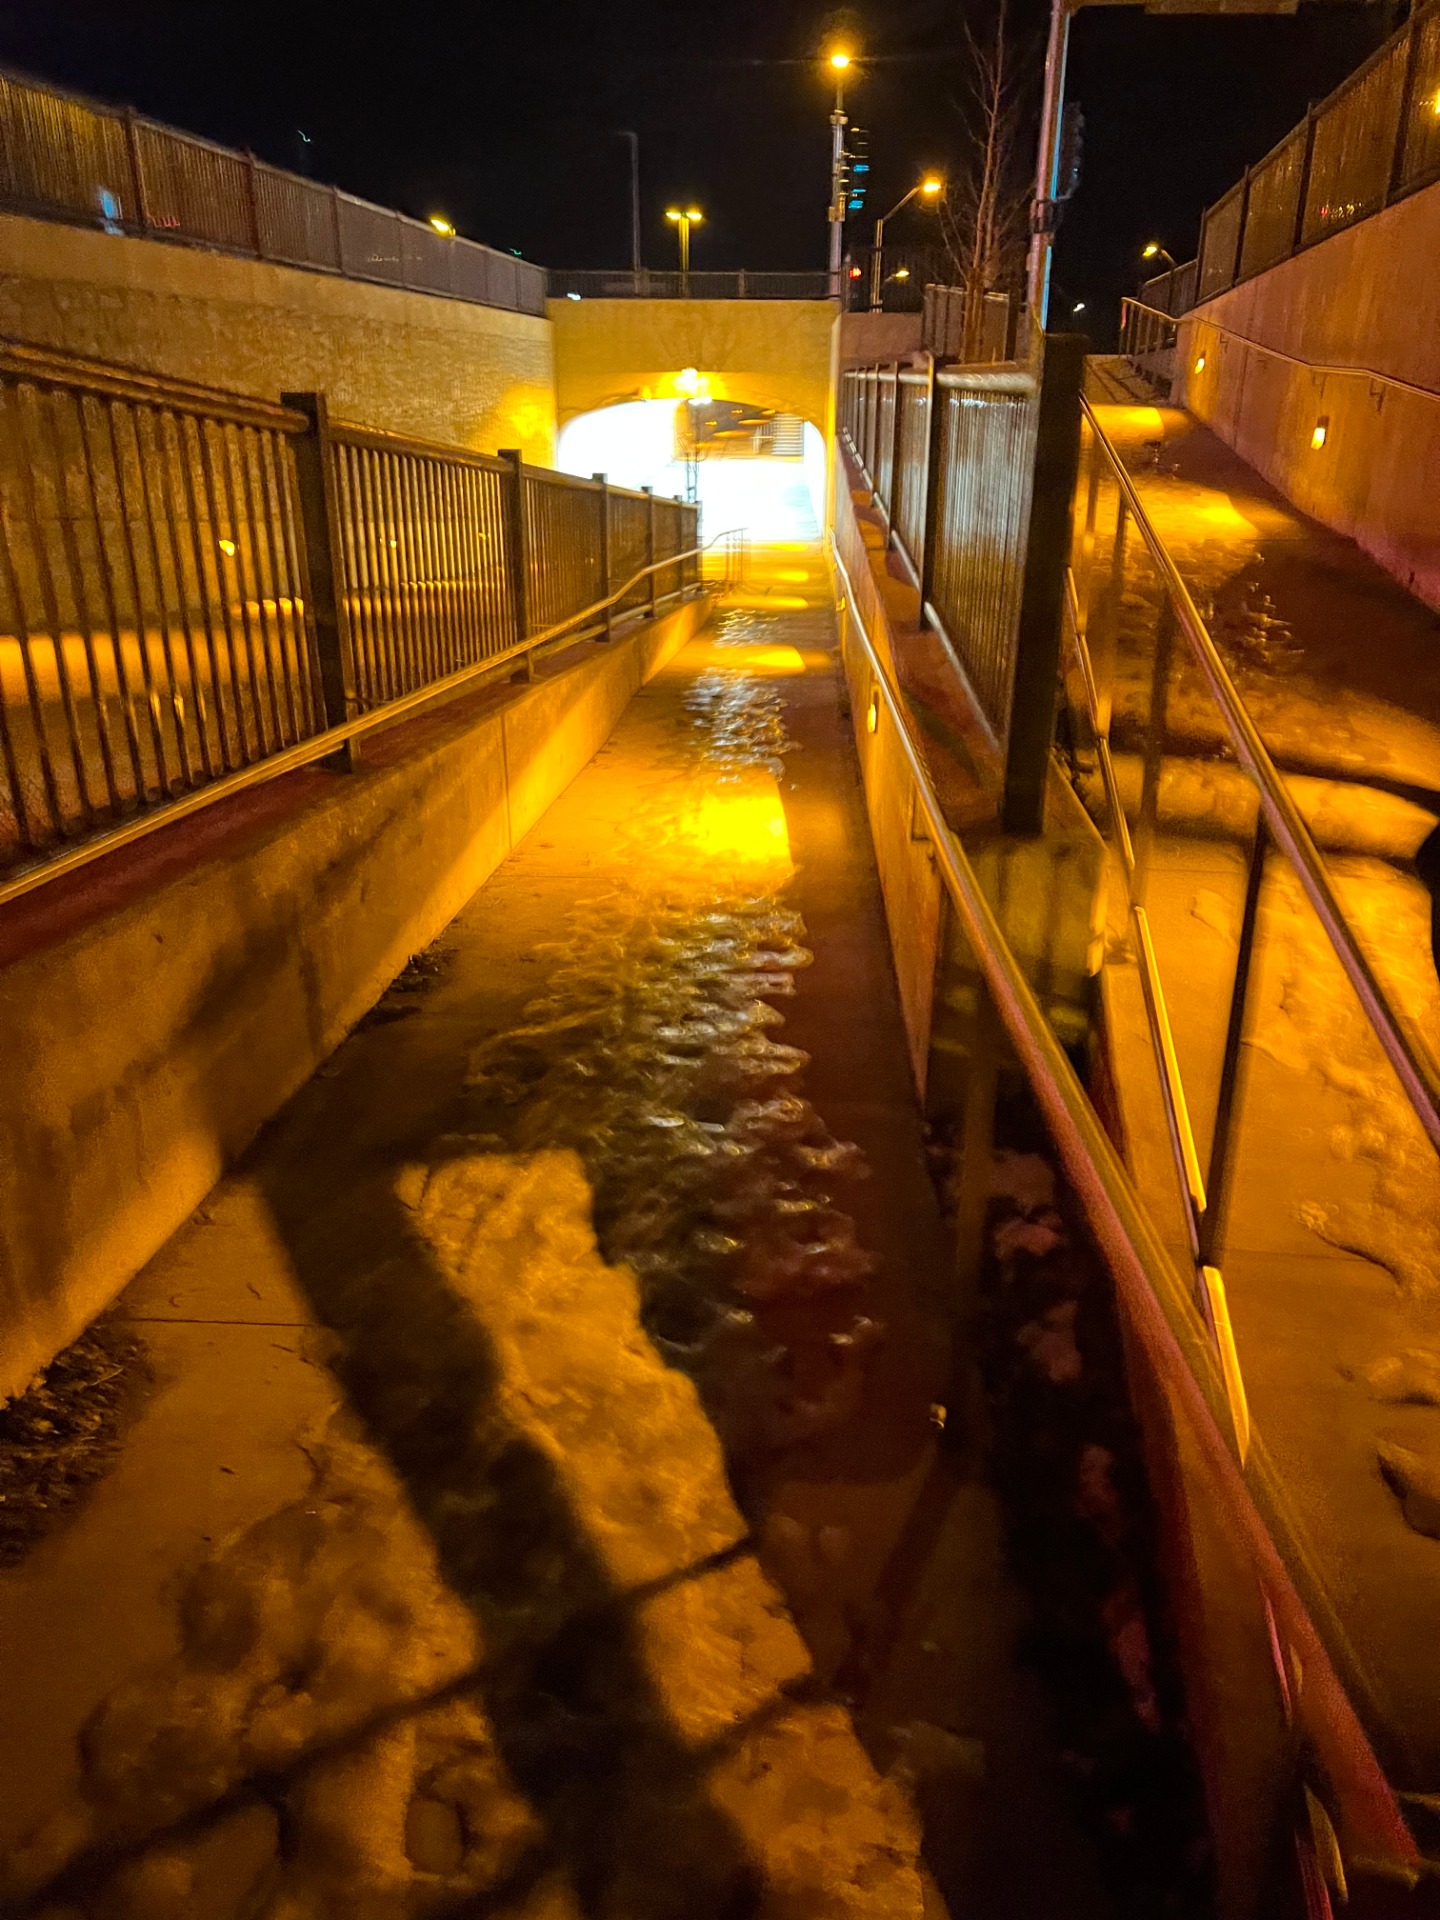
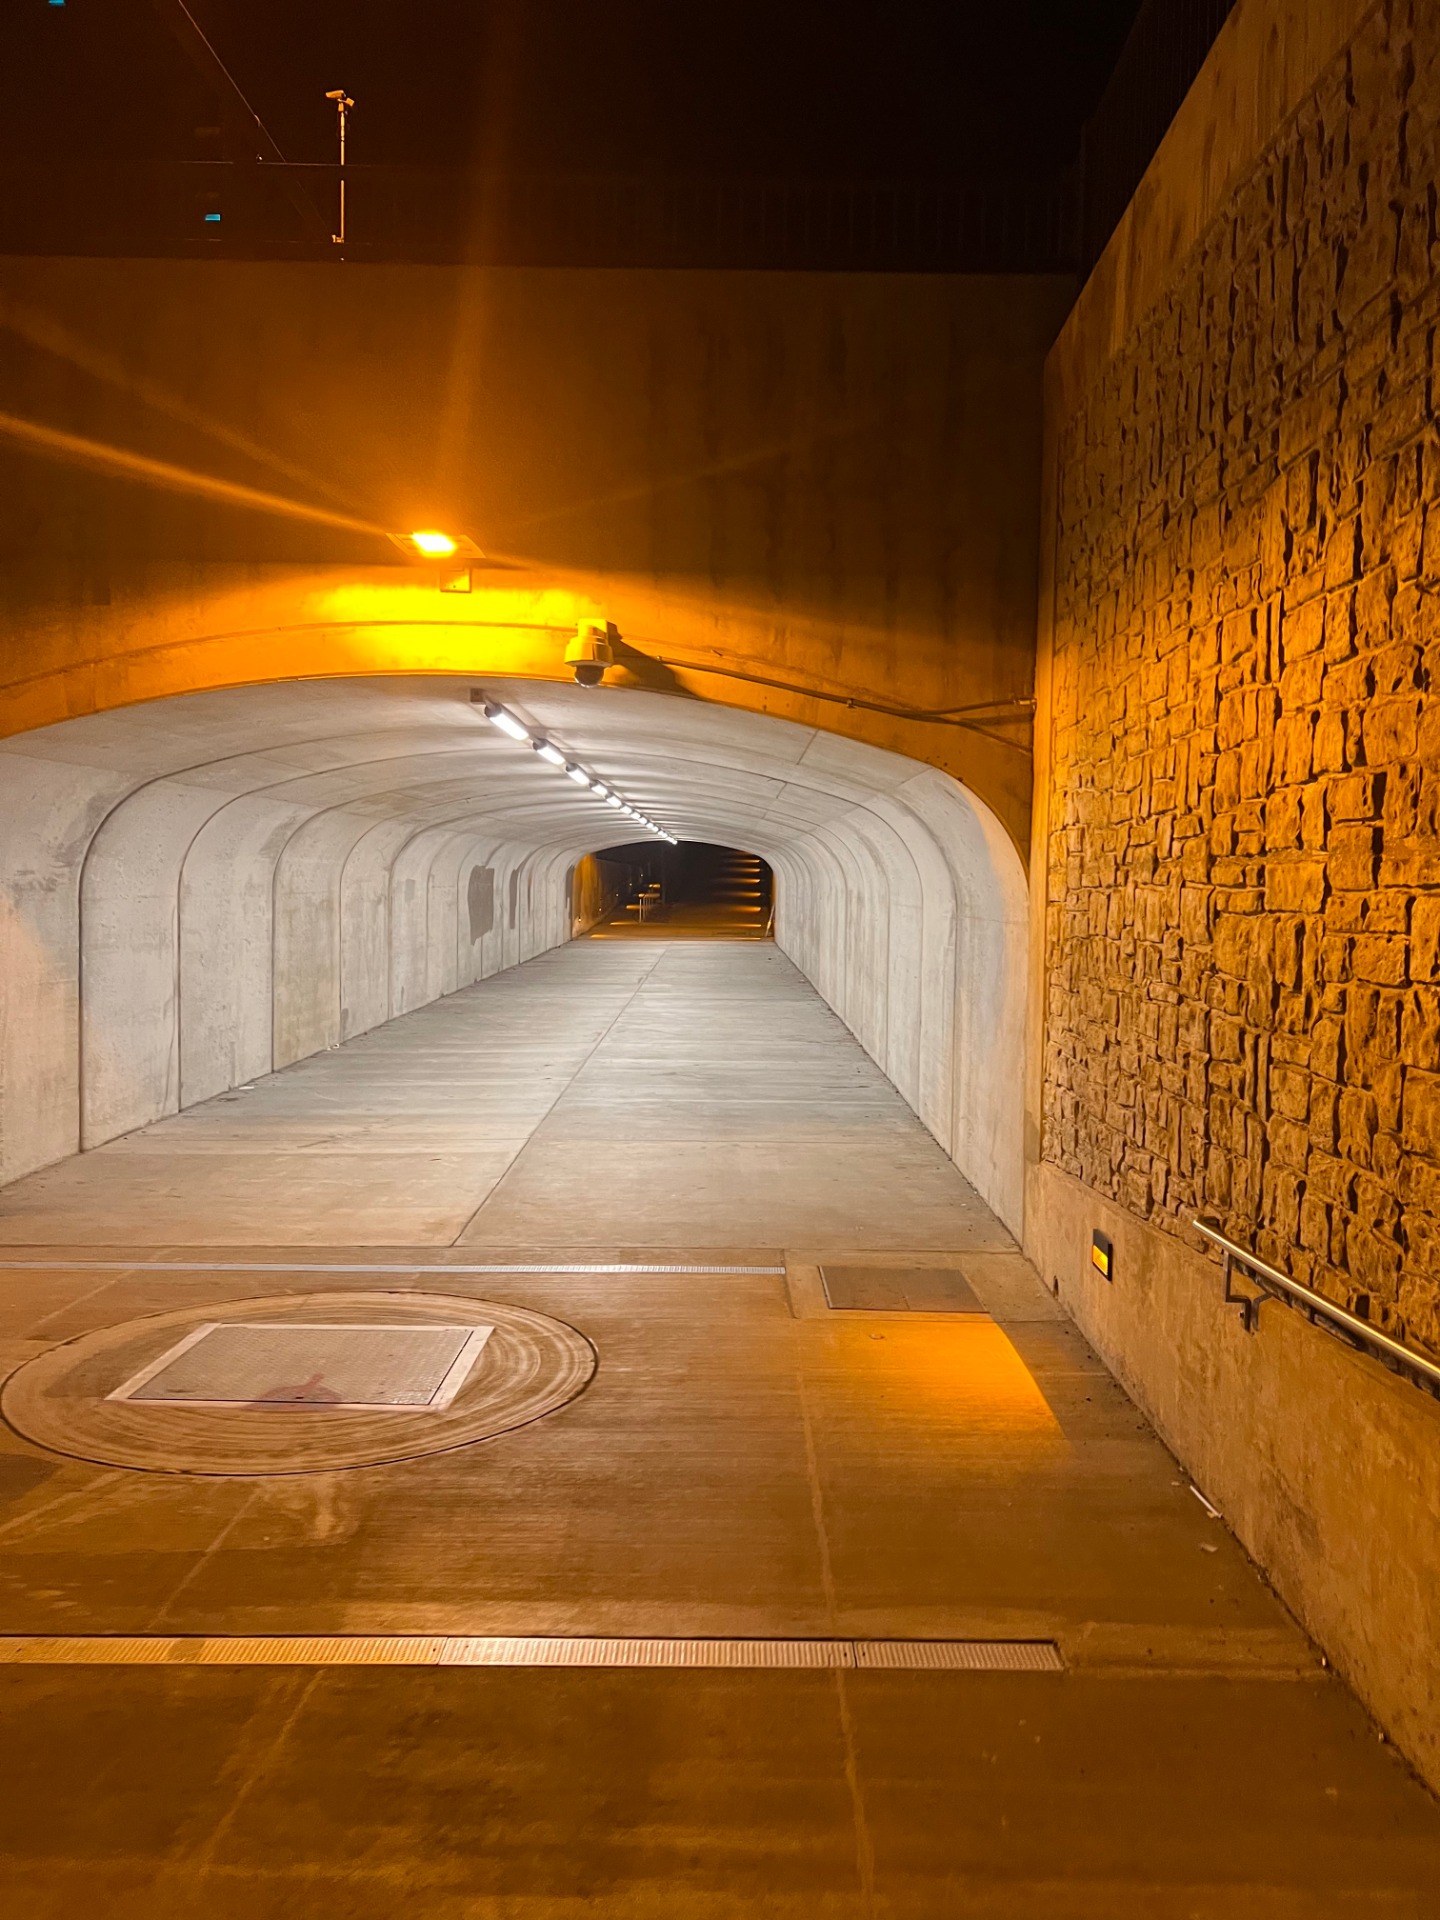
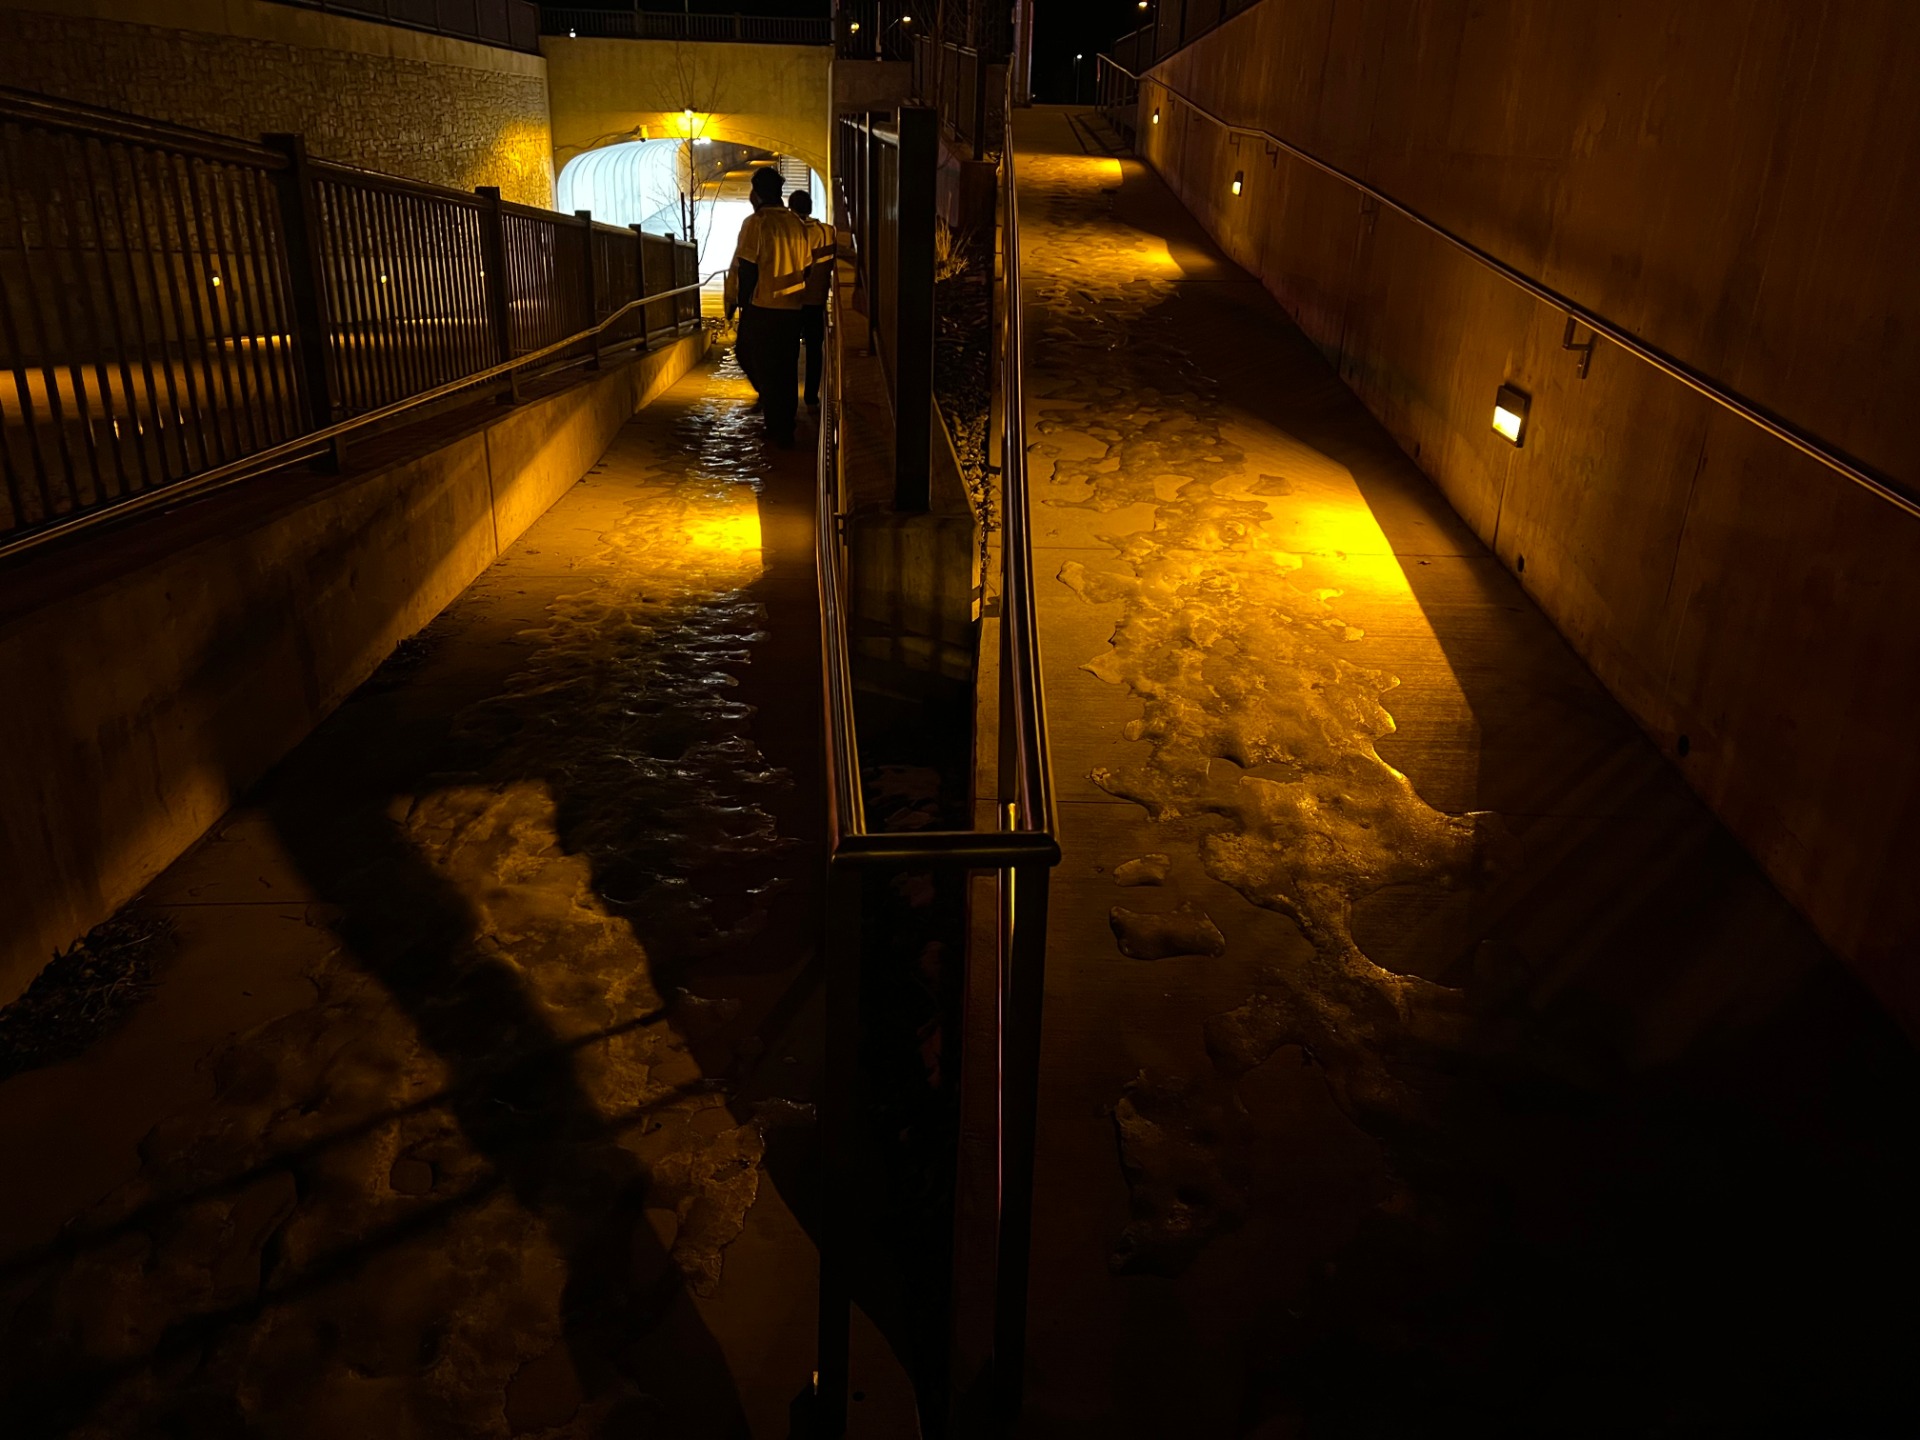
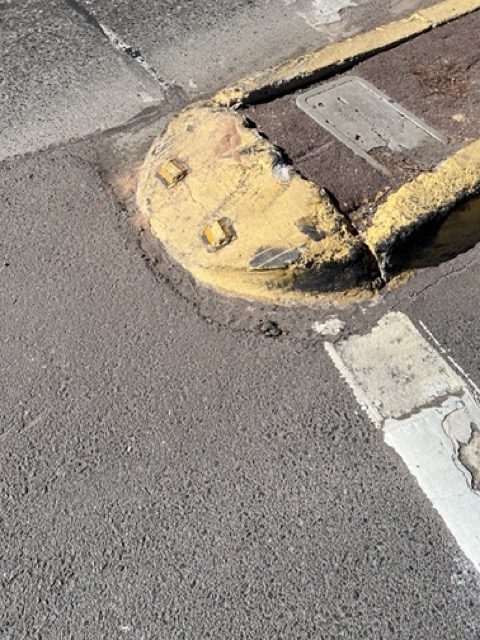
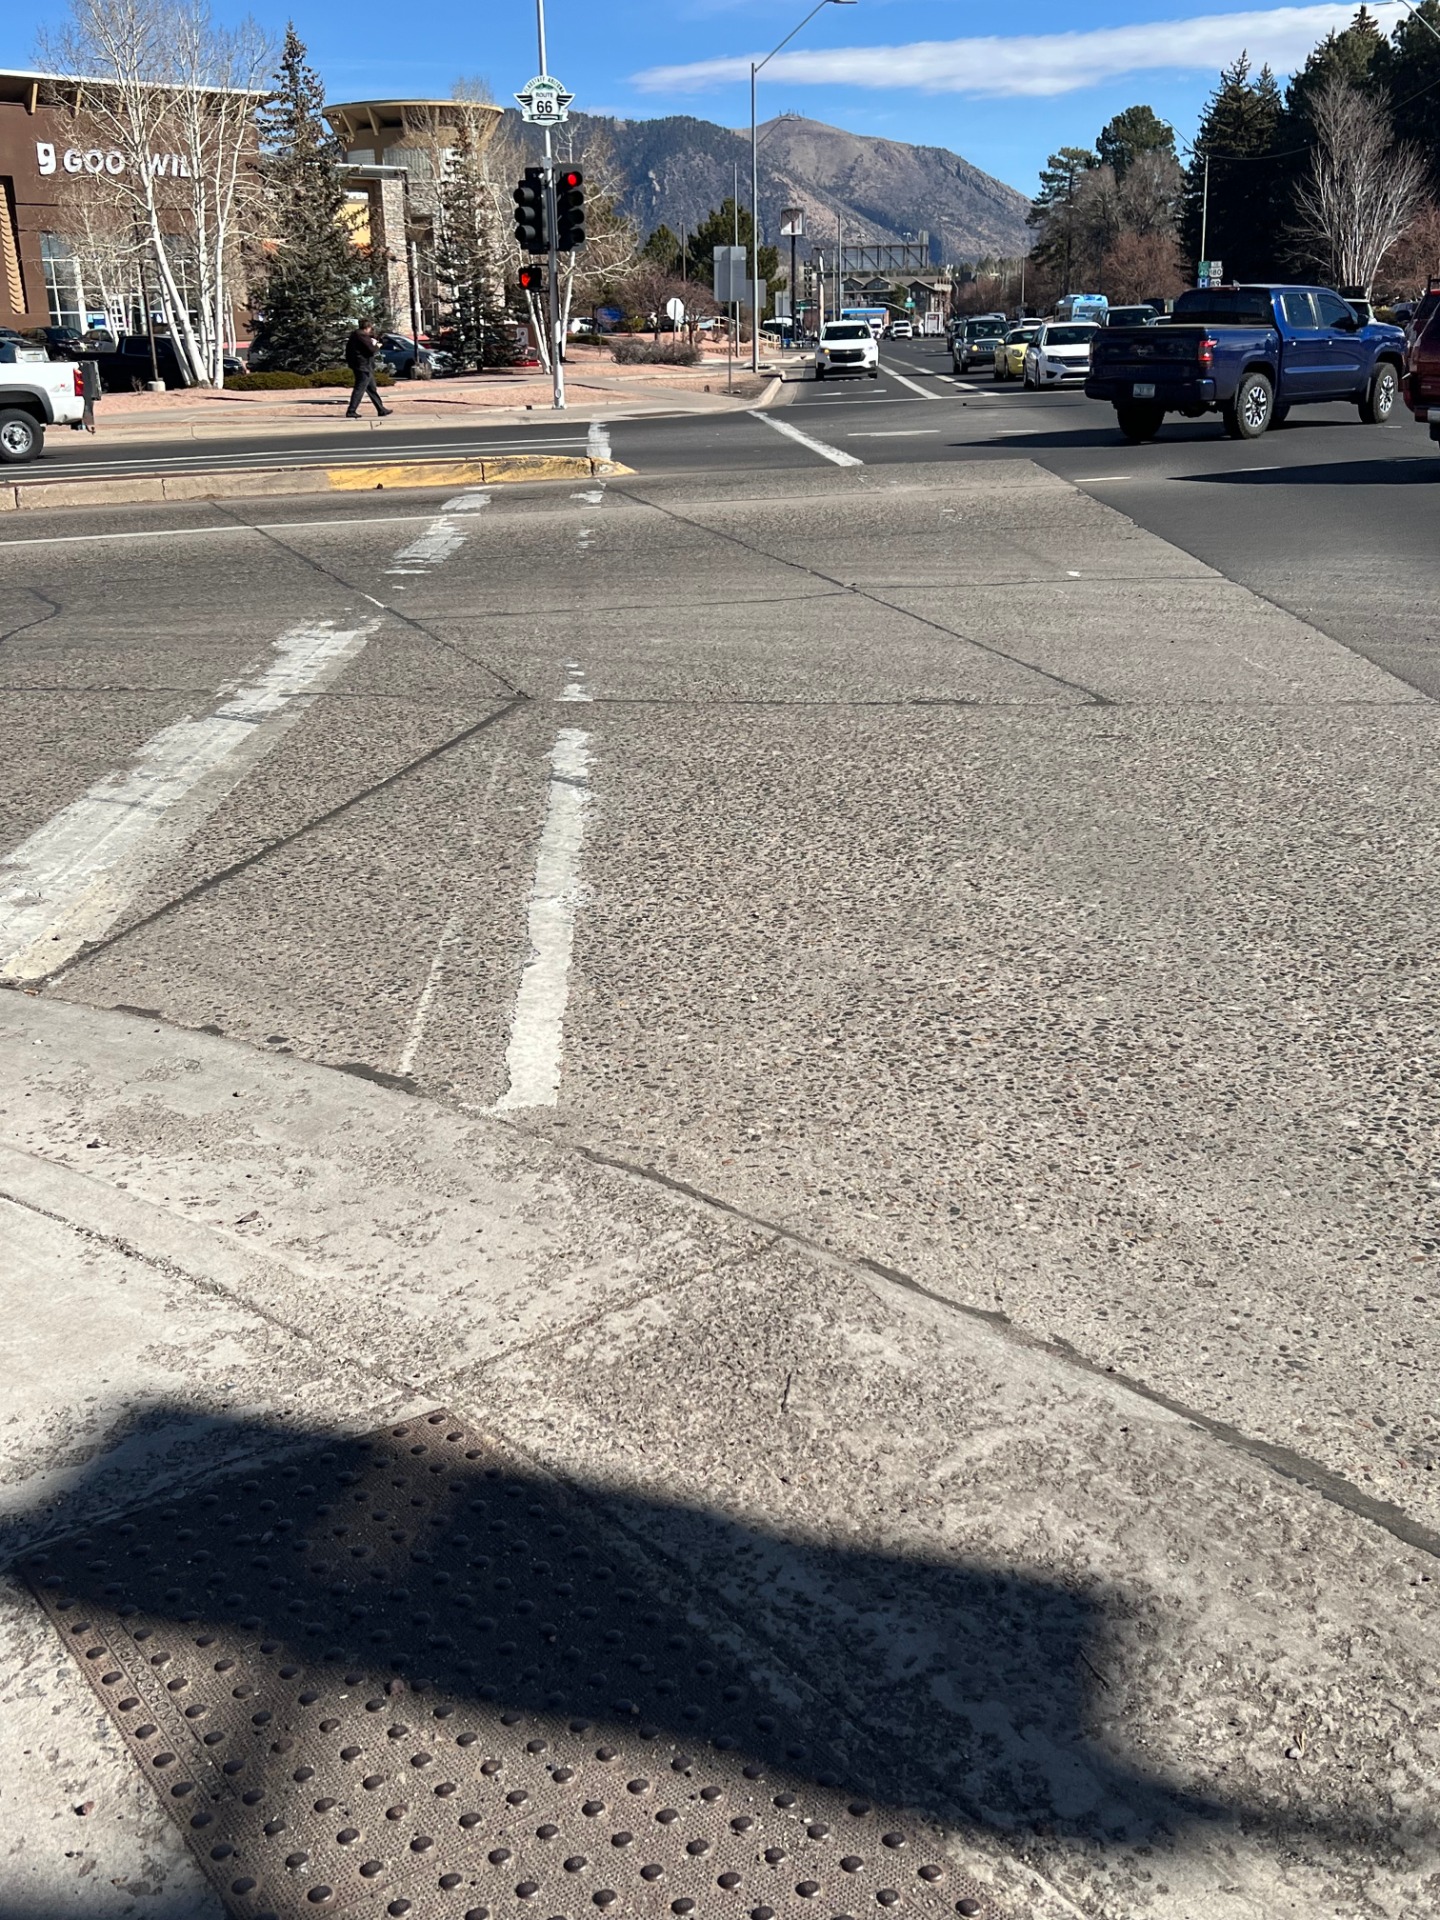
Project location 1 presented many potential issues regarding both vehicle and pedestrian safety. Firstly, the unorthodox median-separated left turn design for the east side leg was observed to be confusing for both drivers using the turn lanes and drivers arriving from the southbound direction. Also seen was a clear lack of signage all around, leading to additional confusion from drivers. In terms of pedestrian safety, the underpass entrance ramp was observed to iced over on multiple occasions, leading to unsafe conditions. Also observed was a lack of railing on the westside underpass ramp, and no snow removal during winter conditions. These problems along with a few others influenced our initial suggested alternatives below:
• Apply de-icing treatments during and after winter storm events
• Install left turn guide striping for southbound direction
• Install temporary delineators and signage for southbound left turn
• Remove or move east side left turn median
• Install leading pedestrian interval at each crosswalk
• Upgrade underpass infrastructure (lighting, railing, heating)
• Remove south side crosswalk for increased vehicle efficiency
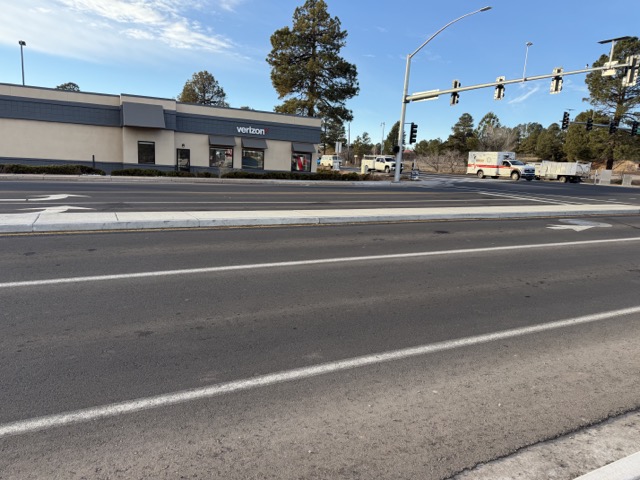
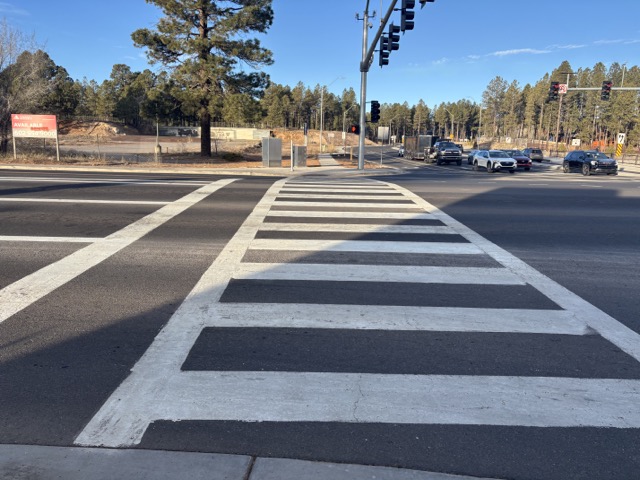
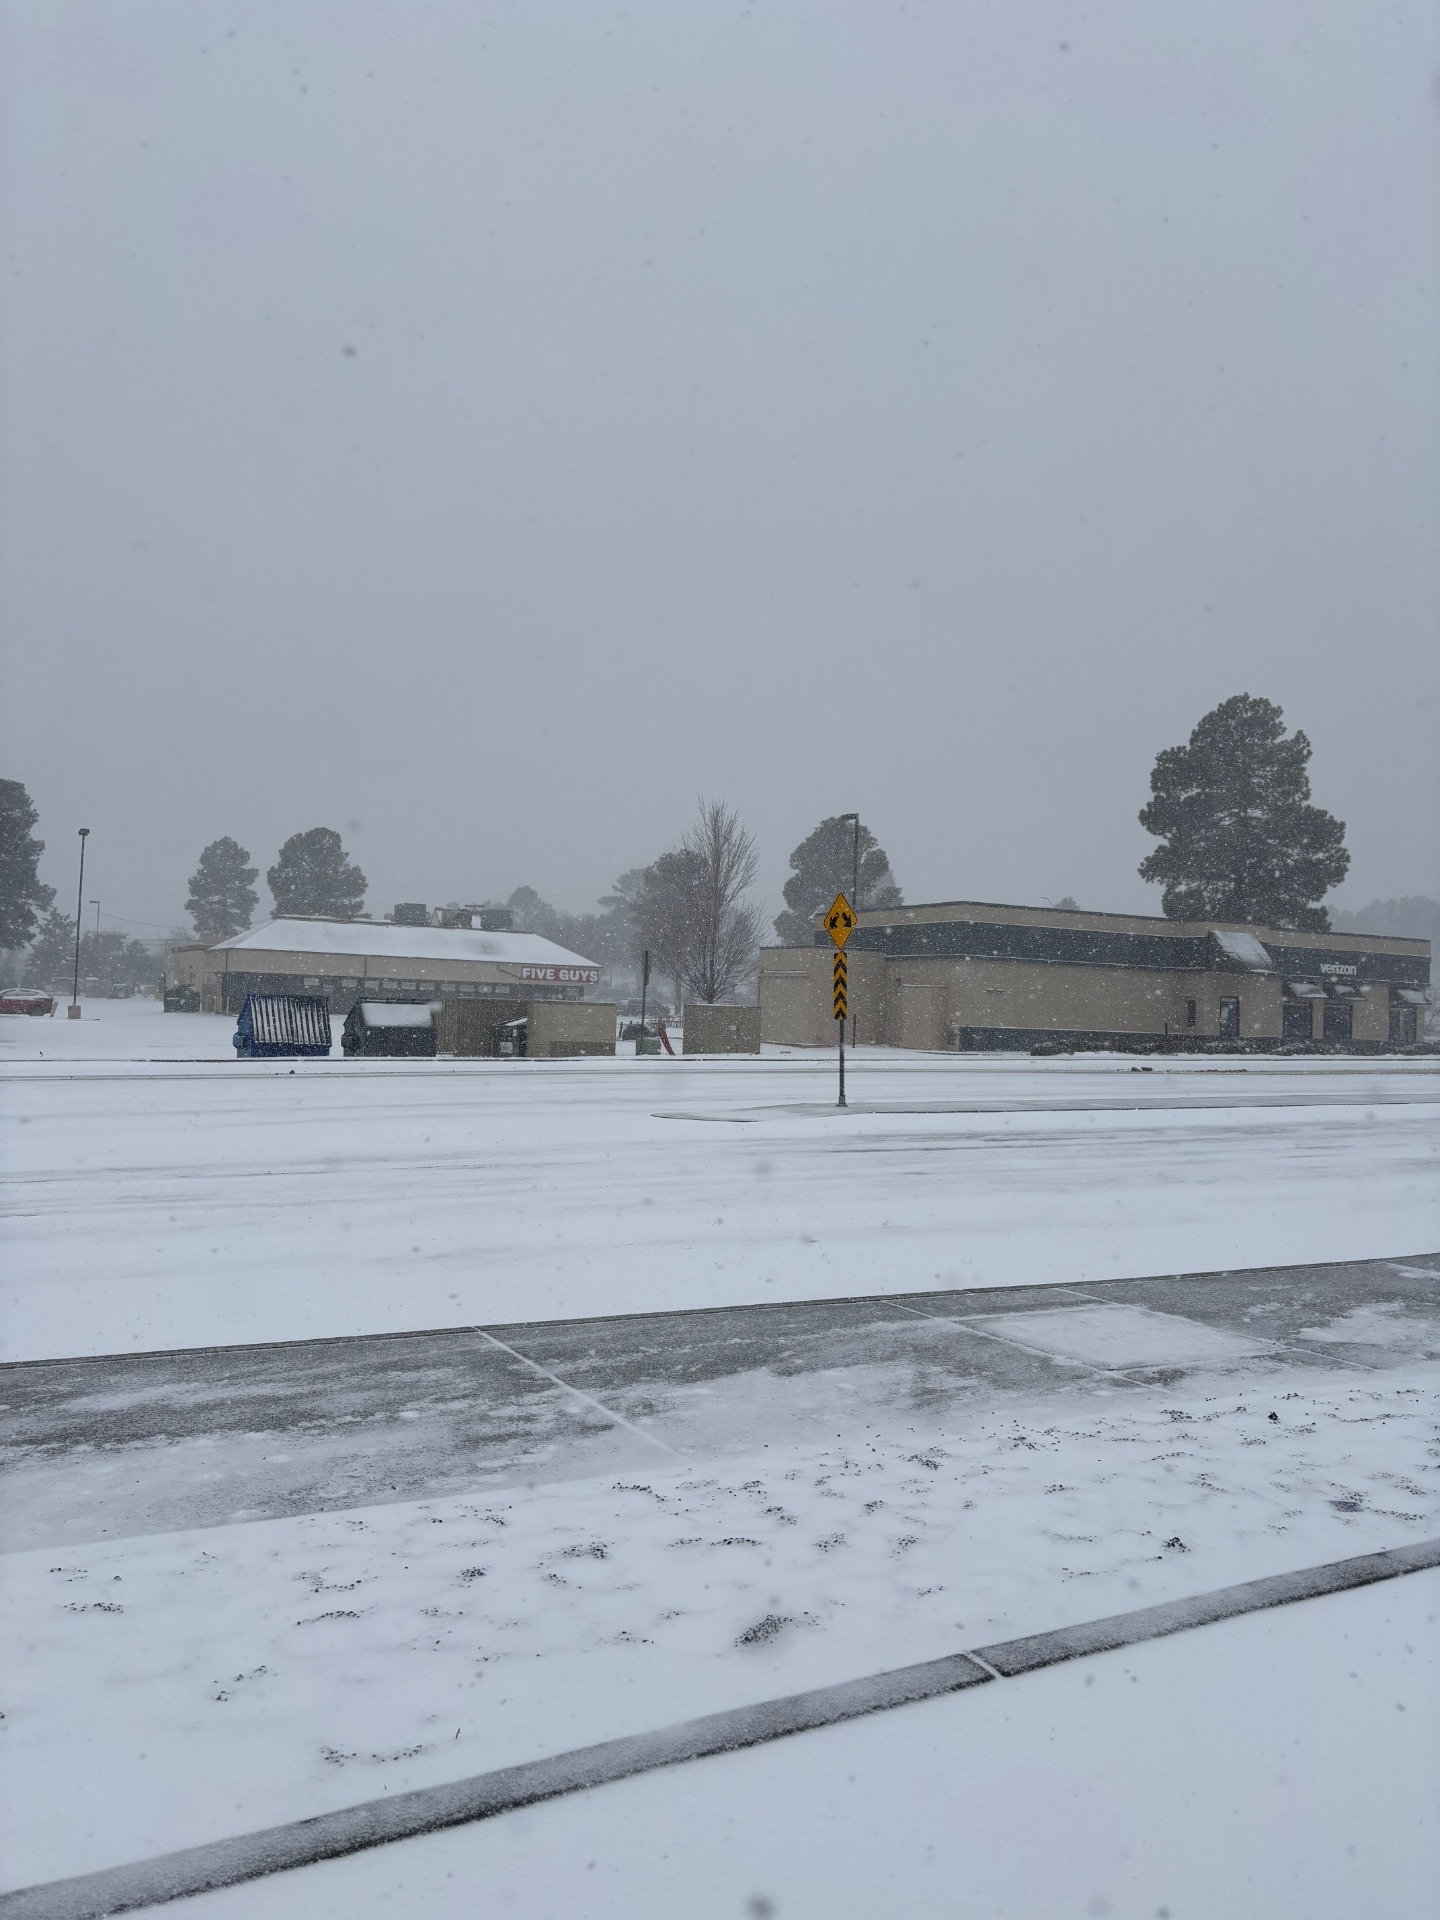
Project Location 2 - Route 66 and Milton Rd
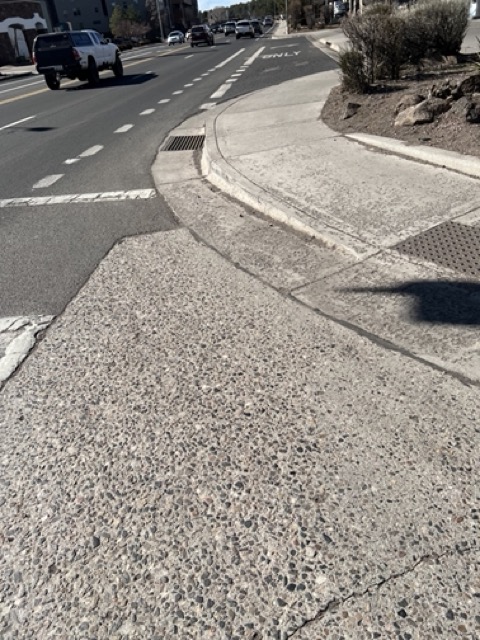
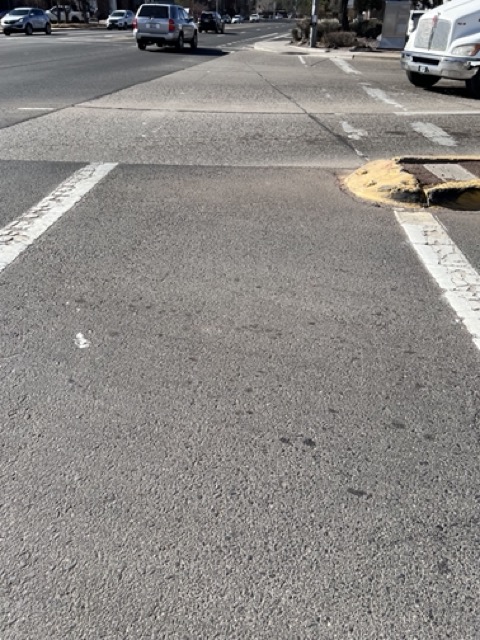
Project location 2 presented fewer functional issues than project location 1, but still contained many problems, especially with the maintenance of the existing infrastructure. As seen in the photos above, the crosswalks, specifically the north/south crosswalk, contained worn striping and a damaged median with no clear delineator. This was observed as an issue during the site visit when northbound left turning traffic sometimes had a hard time distinguishing the correct area to turn into. These problems along with a few others influenced our initial suggested alternatives below:
• Install median delineators for improved driver visibility
• Re-stripe all crosswalks and lane markings
• Repair and/or reconstruct westbound median
• Evaluate eastbound driveway access and signage
• Install leading pedestrian interval at each crosswalk
Back To Top
Decision Matrix
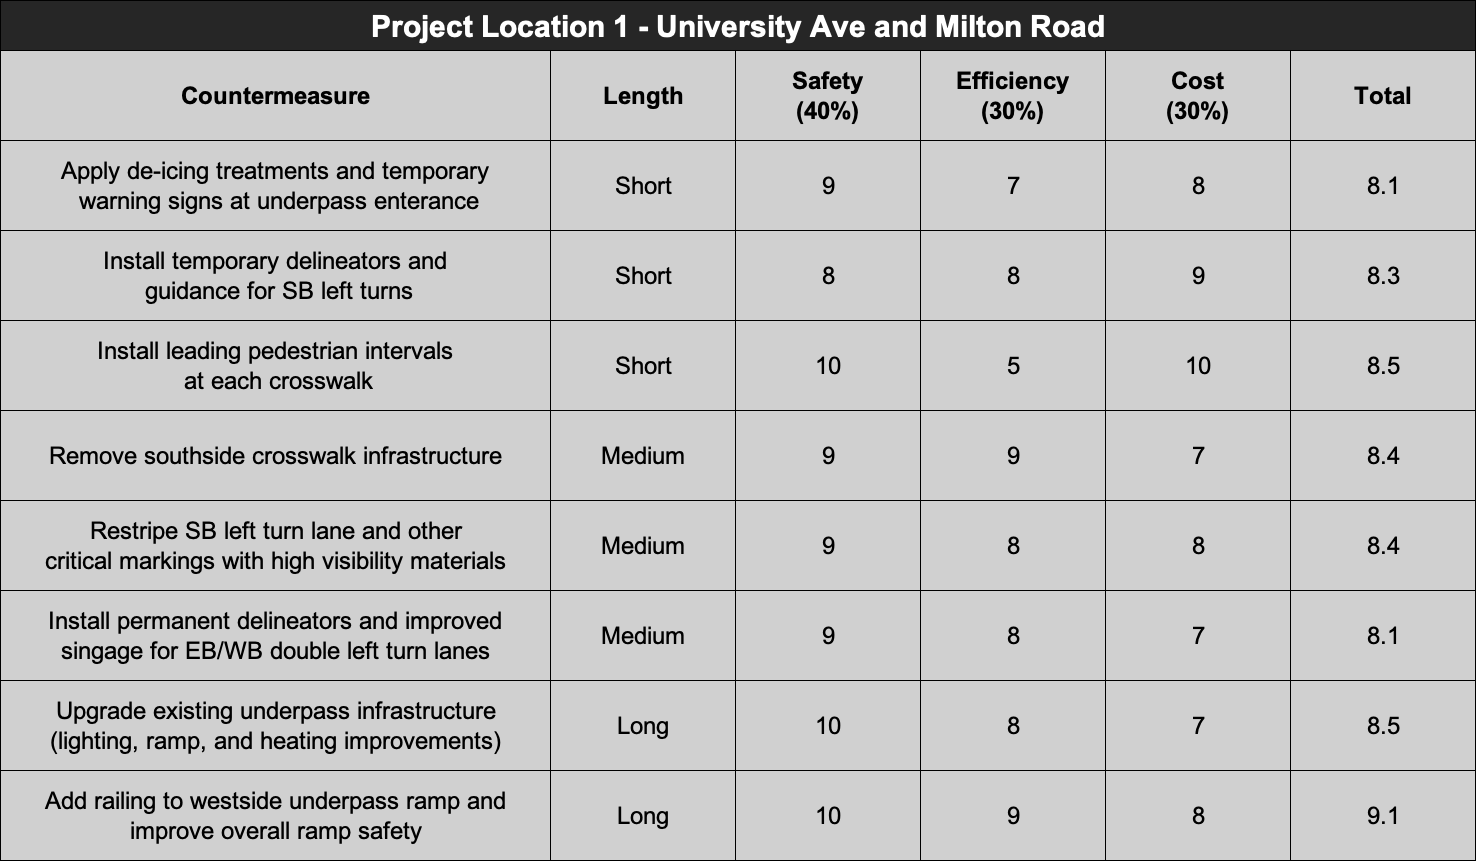
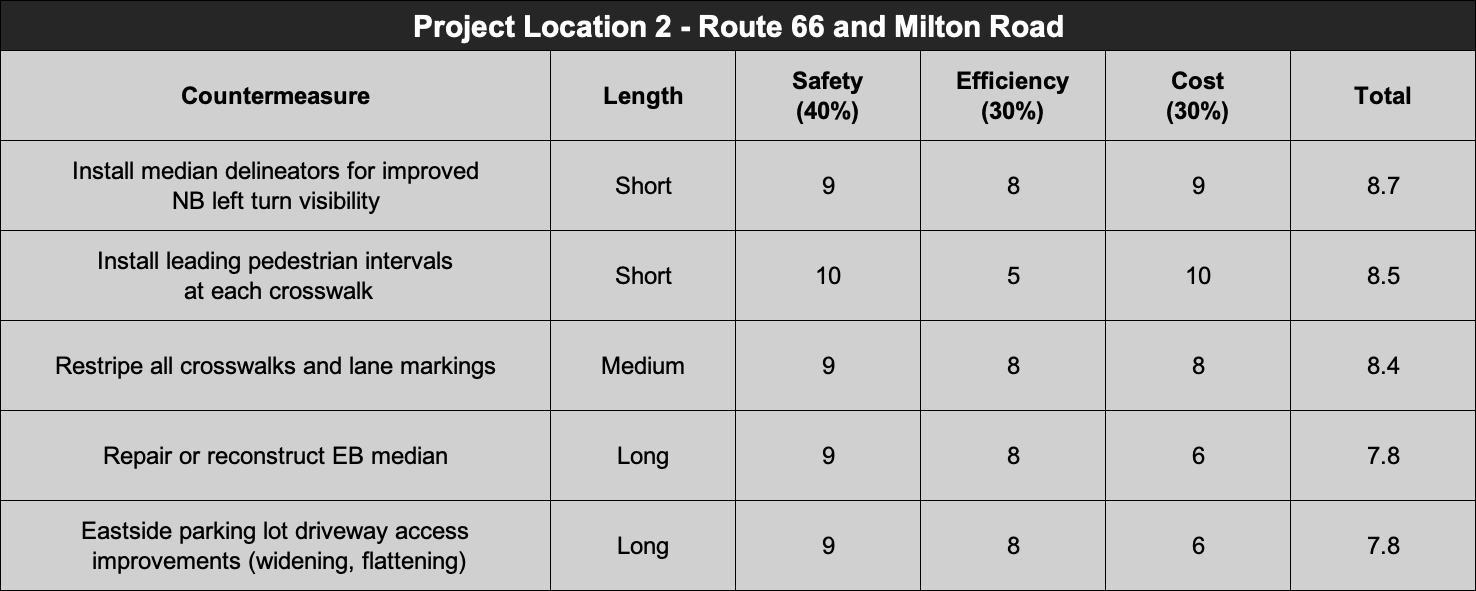
To complete further analysis of our potential alternatives, we evaluated each alternative against the following criteria: Overall Safety improvement, Impact on Efficiency for all road users, and Overall Cost of the Implementation. These categories had the following weights associated: Safety - 40%, Efficiency - 30%, and Cost - 30%. Each alternative was scored on a scale of 1-10 with 10 being the best improvement. Also included is the length to implement each alternative with Short(<5 years to implement), Medium(5-10 years), and Long (>10 years). Below are the decision matrix tables for each respective project intersection.
 Back To Top
Final Recommendations
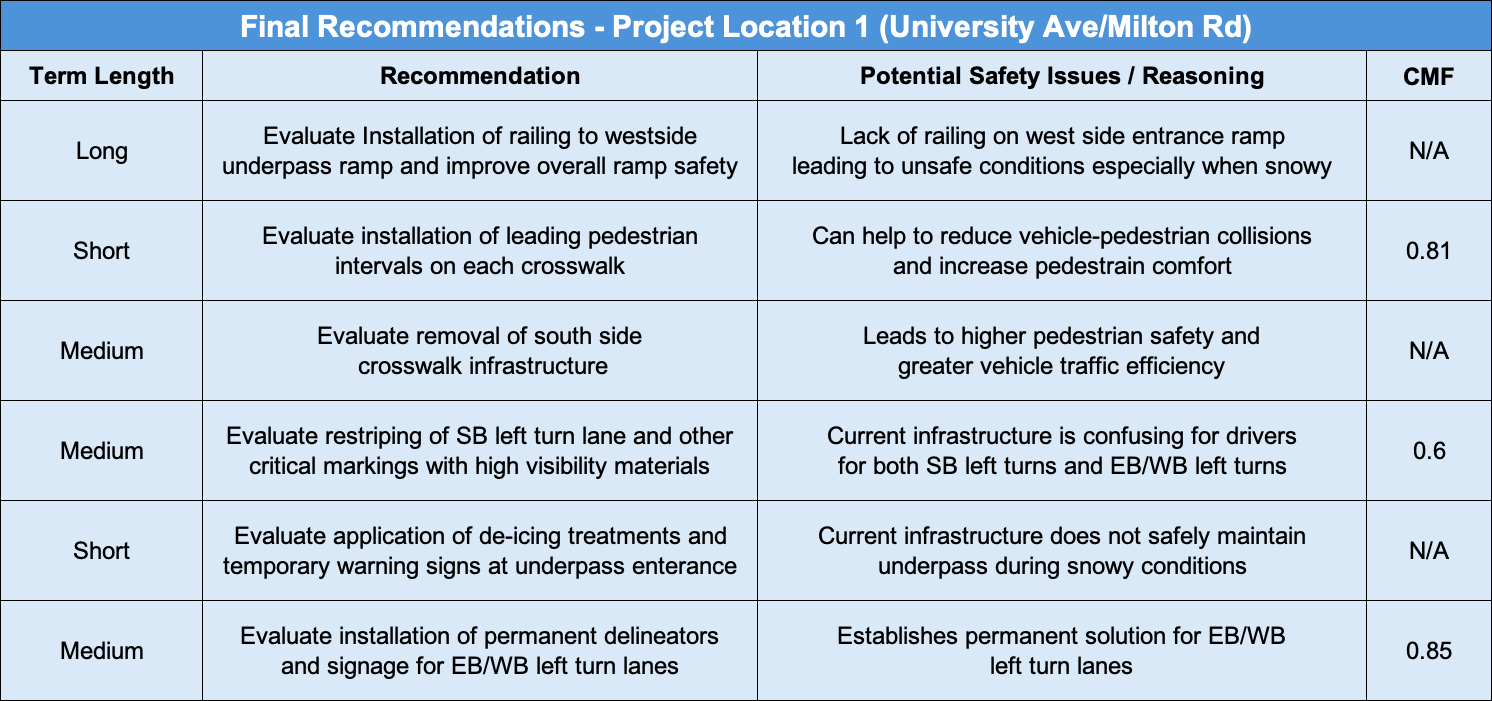
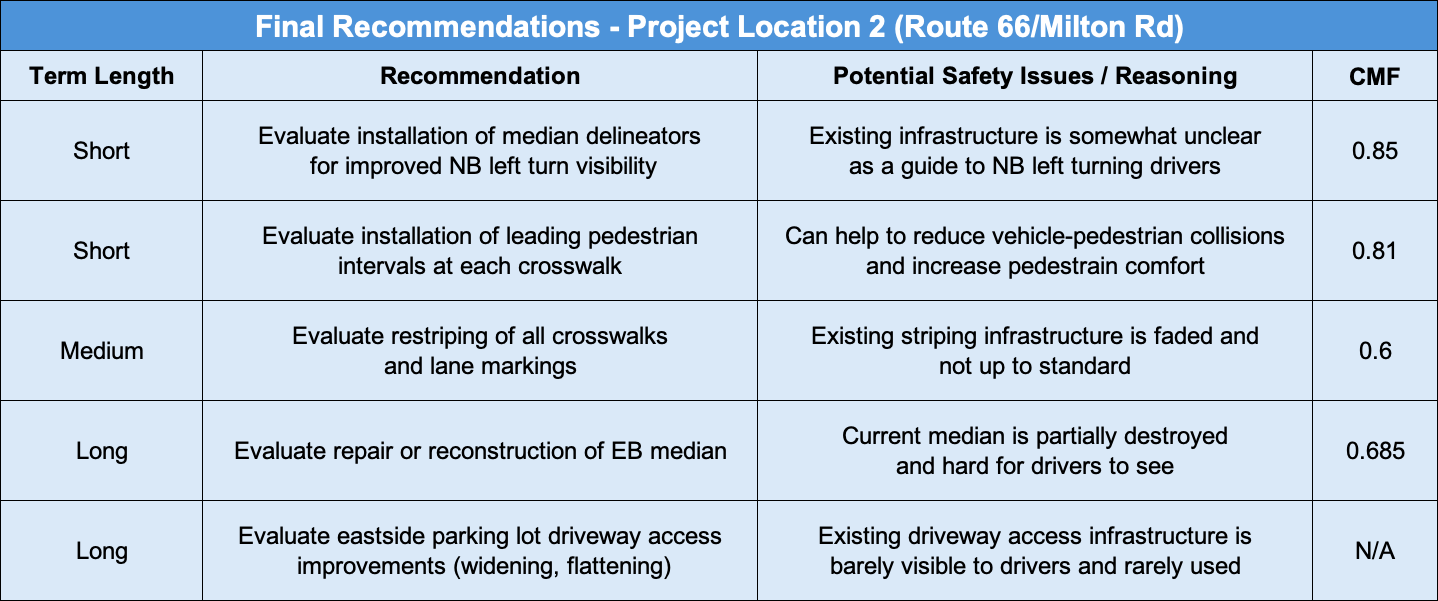
After evaluating each potential alternative for both intersections, we generated a final recommendations table that showcases the best alternatives for each respective intersection. For each table below, the recommendations are categorized by their term lengths along with the value of the respective crash modification factor(CMF) for each alternative. A brief explanation of the perceived safety concern which prompted the alternatives is also included. The higher an alternative is on each table represents the priority it is to implement at the respective intersection, in our view.
 Back To Top
Cost of Implementation
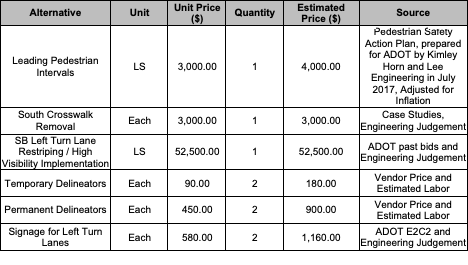
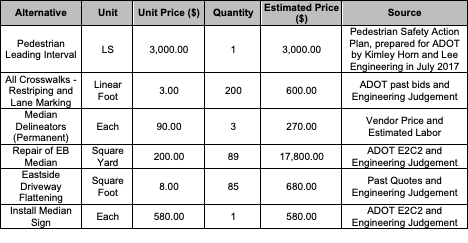
The following tables give an insight into the total costs for completing the recommended alternatives for both Project location 1 and Project location 2 respectively. Each table includes the specific alternatives with the respective estimated cost and source based on previously completed projects.
Project location 1 - University Ave/Milton Rd
Project location 2 - Route 66/Milton Rd
 Back To Top